How to make maps with Fusion Tables

Inspired by the Guardian Data Blog I decided to explore Fusion Tables and Google Maps with Australian data. To start with, I selected a set of Socio-Economic Indexes for Areas, created from 2006 Census data, and postal area boundaries from the Australian Bureau of Statistics (ABS).Today I would like to share a few observations regarding creating maps with data from Fusion Tables.

Although Fusion Tables is not yet a fully featured thematic mapping, analysis and publishing application however, with a little bit of effort, anyone can create informative maps which are visually attractive and fast to deploy. The best thing about Fusion Tables is that you don’t need to manage any complex infrastructure yourself and that the application is free (however, with some limitations on data storage volumes, currently capped at 250MB per account).

Spatial Data

Since Fusion Tables support spatial data only in KML format you have to convert your dataset before uploading it to the server, or alternatively, find a publicly available table that has already been uploaded by someone else.

Google provides a tool to translate SHP data into KML format and to import directly into Fusion Tables but it didn’t work for me with complex data. There are some free alternatives available (really easy to use one is QGIS, for example) but loading other than KML data into Fusion Tables will always be a multi step process.

If you decide to upload your own data, please note a couple of annoying limitations of Fusion Tables. Firstly, complex polygon structures are not supported (for example, I could not upload postcode number 0822 in Northern Territory at full resolution, yet it works perfectly with Google Maps). Secondly, some larger polygons and/or with many parts get generalised automatically as you load them to Fusion Tables as, for example, postal area 7255 in Tasmania (compare the results below – the same KML file as imported to Fusion Tables, on the left, and as displayed directly on Google Map – note green outlines on all, even the smallest islands):
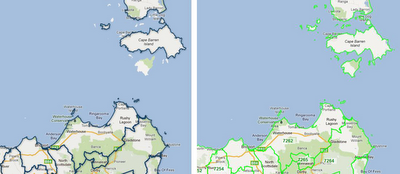

Table search functionality in Fusion Tables is rather crude so, it may not be an easy task to locate what you are looking for. Not to mention that the concept of metadata is non-existent in Fusion Tables so, it is hard to know if the data you find is appropriate for your purposes.

Numeric data

Upload of tabular numeric information in csv format is very straightforward but if you disallow “Export” option up front, you will not be able to edit the data in Fusion Tables. My suggestion is to import the data as “Private” (default option) and allow for “Export”, then add new columns with formulas (if required), and disallow export only when you are ready to publish the data (if at all).

Table Operations

You can easily create a map based on data from numeric tables if those tables contain a “spatial reference” column, for example, postcode numbers (provided you can find equivalent spatial data set in Fusion Tables). To combine numeric and spatial data tables you have to use “Merge” function. My suggestion is to use “smaller table” as a starting point. For example, to create thematic map with postcodes for Sydney area only, select relevant numeric table first and then merge with a table containing postal areas for the entire NSW. Only relevant boundaries will be included in the merged table (ie. the subset of NSW postcodes). If you do the operation in the reverse order, the merged table will contain all postcodes for NSW but only a handful will have the data that can be used in creating a thematic map.

When you “Create View” (ie. copy the table – your own or from other users to your account) or “Merge” tables with spatial geometry column you will lose map formatting parameters (eg. colour setting for polygon fills, etc.). This is very unfortunate, especially when you need to retain colour schema from the original table.

Styling Map

Handling “No data” fields is not easy in Fusion Tables. The problem is that polygons with “no value” in the table default to red fill when rendered on the map (as in the example below – there was no data for 2006 postcode in the merged numeric table). A workaround is to include some value in the table for the missing record (eg. traditional -9999) if you can. Then you can specify map settings to colour only that value, for example, as white and/or fully transparent.
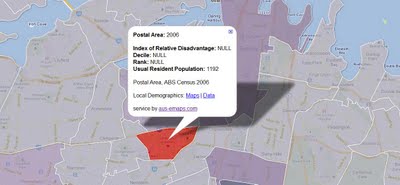

Fully transparent overlays (eg. if fill is set to 0% transparency) are not clickable – it is a very handy feature for handling polygons with missing data in the numeric table (ie. no information window will be displayed when the polygon is clicked). However, when your objective is to present on the map only outlines of the polygons but you still want to display information about those polygons on click of the map, you have to change transparency parameter to a value greater than 0.

Tutorials

If you are eager to start playing with Fusion Tables, Google produced easy to follow tutorial on how to create thematic maps (note, if you are working with your own data, choose “Map” option and not “Intensity Map” in the relevant step).

Secrets and Surprises in Geo APIs Summer Learning Series

The second session of the Geo track at Google I/O was “Secrets of the Surprises of the Google Geo APIs.” Going into I/O we wanted to have a session that could serve as a foundation for later sessions and one where we can feature some of the latest launches leading up to Google I/O. We covered features of the Maps API v3, the Earth API, Fusion Tables, the Maps API Web Services and the Static Maps API in this one session.

What we hope that you take away from this talk is that there is more to the Maps API than just putting markers on a map – we’ve been actively adding many cool features that can really enhance your mapping application and create a better experience for your users.

Here’s a small subset of the features discussed in the talk:

  • With an ever-growing list of cities with 45° imagery available you’re now able to give your users a new perspective of what a place looks like.
    Don’t forget that there are several easy to enable layers available to quickly add content to your map.
  • Developers have frequently requested the ability for API applications users to drag direction routes around the map in a similar manner to Google Maps, so as you might have guessed, enabling draggable directions in the Maps API is now as simple as a one line code change.
  • A favorite feature of the Maps API is the ability to style the base Google map. With the power to change not only the features shown on the map but the color scheme of those features you have tremendous ability to theme your map to fit a look or brand or remove features that are relevant to your users.
  • Street View in the Maps API v3 is implemented entirely in HTML and Javascript so it’s usable on mobile devices with capable browsers without the use of a plugin. This also gives you the power to provide your own custom panoramic imagery and link it to our standard Street View imagery. Don’t let the experience end at the front door – take your users indoors!
  • We’ve added a Distance Matrix service that lets you quickly and easily get travel time and distance between many origins and destinations in one call.
  • In addition to providing driving, walking and bicycling directions the directions service will even optimize the route, determining the best order to visit several destinations.

We talked about a lot more – including AdSense integration, the Places API, useful open source libraries, Fusion Tables and historical imagery, trees and 3D buildings in the Earth API – check out the video or review the slides to learn more!

Google I/O 2011 – The Geo Developers

Google I/O was about the maturation of many of the Geo APIs, this year’s was more about their sophistication, both in the designs discussed and the applications on display. Like the sun standing still at the solstice, let’s take a moment to reflect on recent events and look ahead to the coming season.

Several new features made their debut at I/O this year. The much-anticipated Places API took the stage, as did its companion the Places Autocomplete API. Dynamic Styling was introduced for Fusion Tables layers in the Maps API, allowing layer styling to be defined by the API application via Javascript. Finally, some extremely helpful open source Javascript libraries were introduced to make Maps API development even easier.

Joining us on stage were several developers who came to share their expertise. Justin O’Beirne of 41Latitude talked about map usability and design in the “Designing Maps Applications for Usability” session. The Guardian UK’s Simon Rogers joined us to talk about how the Guardian is using Fusion Tables to visualize the data they collect in “Managing and Visualizing Your Location Based Data.” Yoni Samlan from SCVNGR also came to discuss developing with the Places API in “Location-based App Development.”

In addition to the sessions led by the Geo team, the developer sandbox featured eight Geo API partners who engaged directly with I/O attendees. Joining us in the sandbox were HistoryPin, Icon Fitness, Ubisense, The Wall Street Journal, Footprint Feed, The Bay Citizen, Arc2Earth, and Travel Game. The apps on display ranged from location-based gaming using the Latitude API to tools for citizen journalists to map public data using Fusion Tables. You can learn more about two of our sandbox partners in these video case studies:

  • The Bay Citizen (video) – The Bay Citizen explains the benefits of the Fusion Tables layer with Google Maps API to build infographics for their online newspaper. The Bike Accident Tracker visualizes the prevalence of bike accidents across San Francisco.
  • Historypin (video) – HistoryPin lets users upload historical photos, geotag them on a Google Maps, and overlay the old imagery on top of new Street View imagery, enabling users to see what their cities looked like at different points in time.


Geo APIs Summer Learning Series (apologies to the Southern Hemisphere)

But at the heart of Google I/O are the sessions themselves. This year, speakers from the Maps, Earth, and Fusion Tables teams covered a wide range of topics, from ensuring high performance and usability across all browsers to visualizing huge data sets with Fusion Tables. The amount of material covered was enormous…but we want to expand upon it.

To that end, we’re pleased to announce the “Geo APIs Summer Learning Series” on the Geo Developers Blog. Over the coming weeks, each talk will be getting its own blog post from the session speaker, pulling in what was discussed at I/O and then digging deeper into the technical content. Here is how the series will unfold:

Week of July 6th
Connecting People and Places
Location Based App Development using Google APIs
Secrets and Surprises of the Google Geo APIs

Week of July 11th
Managing and visualizing your location based data with Fusion Tables
Designing Maps Applications for Usability on Mobile and Desktop

Week of July 18th
High Performance KML for Maps and Earth
Speedy Maps

Week of July 25th
Map your business, inside and out
GIS with Google Earth and Google Maps

If you’d like a head start, videos of all the I/O sessions are linked above. Be sure to visit the Geo Developers Blog throughout July for even more great content from the Maps, Earth, and Fusion Tables teams.