Google Maps: The power of Fusion Tables with Dynamic Styling

The Fusion Tables Layer has been one of the most successful new features launched in the Maps API in the last year. We have seen a wealth of fascinating data visualizations that rely on Fusion Tables, such as the Bay Citizen Bike Accident Tracker and the WNYC Police Precinct map.

At Google I/O this week, Simon Rogers of the Guardian joined me and Kathryn Hurley of the Geo Developer Relations team to present some examples of how the Guardian uses Fusion Tables to visualise data for their readers, and introduce some great new features:

Fusion Tables allows you to share large tables of spatial data and render them on a map in a way that performs consistently well across all browsers, on desktop and mobile. The way in which the data is styled on the map, the markers used for points, the colours and stroke widths used for polylines and polygons, can be defined by the owner of the table in the Fusion Tables application, or using the new Fusion Tables Styling and InfoWindows API. However only the owner of the table can define the styling in this way, and styling for any single table is fixed.


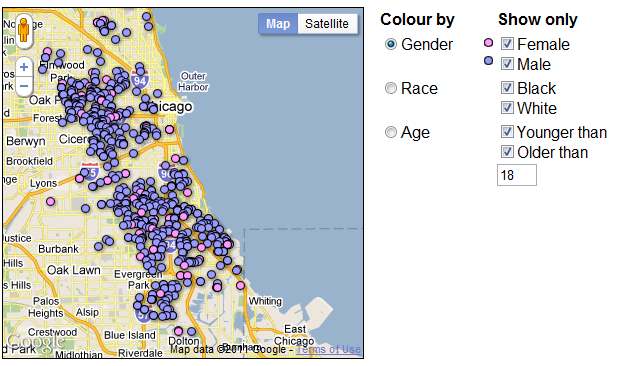
At Google I/O we introduced Dynamic Styling of Fusion Tables layers. This allows the styling rules used for displaying a table in a Maps API application to be defined from JavaScript, and changed dynamically. For example you can use this to switch between rendering different data sets in the same table, or giving users control over which subset of the data is highlighted, as in the below example based on a public table of Chicago Homicides data:


In order to ensure the continued reliability of the Fusion Tables layer, we are also introducing some limits on the number of layers that can be used, and the complexity of styling. The Maps API now permits up to five Fusion Tables layers to be added to a map, one of which can be styled with up to five styling rules.

For information and code samples of how to apply dynamic styling to Fusion Tables, see our documentation, and for further assistance I recommend the Google Maps JavaScript API V3 forum. It’s great to see the creative ways in which Fusion Tables Layer is being used, and we hope this new flexibility will drive even more inspiring and informative Maps API applications.
Search your geo data using spatial queries from Fusion Tables!

I’m Kathryn Hurley, a Developer Programs Engineer for Fusion Tables, and I have to say, I really dig Fusion Tables. The power it gives you to visualize your data is amazing! Plus, the team is working hard to add new features that give even more power to you, the developer.

It is my pleasure to announce that Fusion Tables now offers spatial queries! Using spatial queries, developers can (1) find all features that are located within (or overlap with) a given distance from a location (2) find all features that are located within (or overlap with) a given bounding box, and (3) find a given number of features closest to a location.

To demonstrate some of the new syntax, let’s go through a potential use case of spatial queries: creating a store locator map. For this demo, I set up a table in Fusion Tables, 297050, containing the locations of a fictitious pizza restaurant chain in the San Francisco bay area. The table contains the name, location, and whether or not that location delivers.

Now let’s say we want to display all the restaurants that fall within a bounding box. To do so, use the syntax:

SELECT * FROM 297050 WHERE ST_INTERSECTS(Address, RECTANGLE(LATLNG(37.2, -122.3), LATLNG(37.6, -121.9)))

The map to the left shows this query in action using the FusionTablesLayer. The example shows all rows in the pizza table that fall within the bounding box specified with a lower-left coordinate of 37.2, -122.3 and a upper-right coordinate of 37.6, -121.9.

This is the code for the FusionTablesLayer:

map = new google.maps.Map(document.getElementById('map_canvas'), {
   center: new google.maps.LatLng(37.4, -122.1),
   zoom: 10,
   mapTypeId: google.maps.MapTypeId.ROADMAP
});
tableid = 297050;
layer = new google.maps.FusionTablesLayer(tableid, {
   query: "SELECT Address FROM " + tableid + " WHERE ST_INTERSECTS(Address, RECTANGLE(LATLNG(37.3, -122.3), LATLNG(37.6, -121.9)))",
   map: map   
});

We can also find the 10 features closest to a particular coordinate, such as the latitude, longitude coordinate of your house or a major city center. To find the 10 nearest features to Mountain View, CA at coordinate 37.4,-122.1., we use the syntax:

SELECT * FROM 297050 ORDER BY ST_DISTANCE(Address, LATLNG(37.4, -122.1)) LIMIT 10

These 2 examples demonstrate how to create a store locator-like map, but the possibilities are endless! You could create an application that finds the most popular bike trail routes in your area or enable crowd sourcing to identify roads that might need more street lamps.

To learn more about the full spatial query offering in Fusion Tables, please see the Fusion Tables documentation. You can also join the Fusion Tables User Group to receive announcements about new features or post questions you might have about Fusion Tables. Or follow us on Twitter: @GoogleFT. And, most importantly, have fun creating awesome apps!

Posted by Kathryn Hurley, Google Geo Developer Relations