 |
$62.00 (0 Bids)
End Date: Sunday Oct-14-2012 4:52:34 PDT
|
|
$62.00 (0 Bids)
End Date: Sunday Oct-14-2012 4:52:34 PDT
|
The Google Maps API provides a robust platform in which you can add geographical context to your data in a variety of ways. Data visualization is therefore one of the elements at the heart of the Maps API, and today we’re introducing two new techniques for visualizing your data in flexible and dynamic ways.
Symbols
At SXSW Interactive in 2011, I attended a session on geotemporal data visualization that made me keen to make it easier for Maps API developers to build visualizations similar to those discussed. For this reason I’m particularly excited to introduce a simple, yet powerful, new concept to the Maps API v3 that we call Symbols.
Unlike the image icons currently used for marking locations on a map, a Symbol is defined as a vector shape. The size, stroke width, color, and opacity of the shape, are all set by the Maps API application and can be dynamically modified. A small number of shapes, such as a circle, are provided by the Maps API, and custom shapes can be expressed as an SVG path.
Symbols open up a wide range of compelling new possibilities for data visualization and visual effects. For example, the below map illustrates the expansion of the Walmart chain of stores between 1962 and 2006:
In addition to using symbols to represent point features you can also decorate polylines with Symbols. One or more symbols, such as an arrowhead, can be placed at fixed positions on the polyline or repeated along the polyline. Because the polyline that has been decorated does not need to be visible, this feature can also be used to created dotted or dashed polylines, and just as the style of the symbols can be dynamically modified, so too can their location on the polyline:
Heatmaps
Developers often ask how they can represent large amounts of data on a map. Improvements in web browser technology have increased the number of markers that can be rendered by a Maps API application, but above a certain threshold the density of markers can overwhelm the user.
An alternative approach is to use a heatmap, and to enable this approach we’re launching support for browser rendering of heatmaps by the Maps API using the new Heatmap Layer. Your Maps API application can define the colour spectrum, intensity range, and behaviour of the heatmap when the map is zoomed. Here’s the Walmart example from above, but this time visualized as a heatmap:
If you have any technical questions about these new features, we recommend engaging with our developer community online, or joining our regular Google Maps API Office Hours. If you’re at I/O come see us in person at Office Hours in the Google Maps developer sandbox.
Explorers of the world, rejoice! There is now a new way to explore the world, right from the palm of your hand. Gone are the days when the only way to get a bird’s eye, 3D view of your favorite metropolitan area was from the window of a penthouse apartment or helicopter. Now you can soar above your favorite cities in 3D, with Google Earth for mobile.
New 3D Imagery
We recently shared a preview of this striking new 3D imagery and starting today, you can take flight yourself with our latest version of Google Earth for Android. An updated version of Google Earth for iOS will be also be available soon.
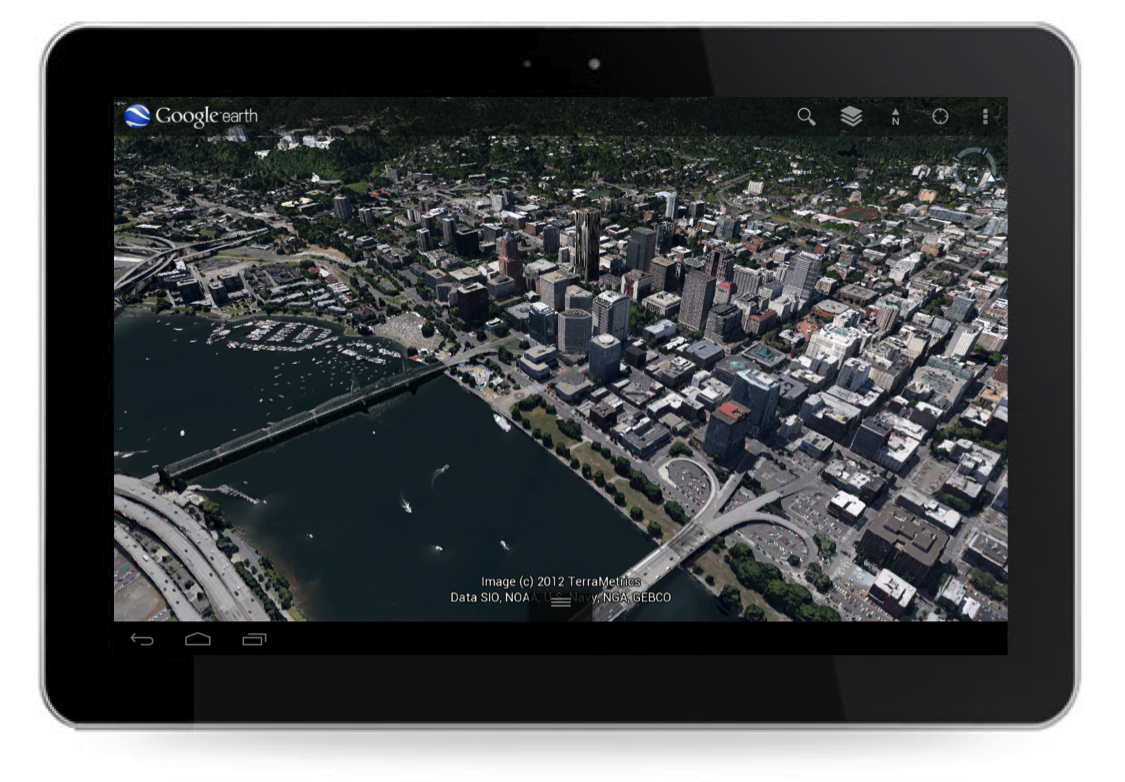
New 3D imagery of Portland, Oregon
Creating this comprehensive 3D experience is possible due to advanced image processing. Using 45-degree aerial imagery, we’re able to automatically recreate entire metropolitan areas in 3D. This means every building (not just the famous landmarks), the terrain, and any surrounding landscape of trees are included to provide a much more accurate and realistic experience.
Get started today by taking a virtual flight over one of our initial 3D imagery cities: Boulder, Boston, Santa Cruz, San Diego, Los Angeles, Long Beach, San Antonio, Charlotte, Tucson, Lawrence, Portland, Tampa, Rome or the San Francisco Bay Area (including the Peninsula and East Bay). We’ll continue to release new 3D imagery for places around the world over the coming months; by the end of the year, we aim to have new 3D coverage for metropolitan areas with a combined population of 300 million people.
Tour Guide
Not sure where to begin? Let the new tour guide help show you the way. We’ve put together short tours of thousands of famous places and historical sites across the globe so it’s easier than ever to discover amazing places. Just pull up the tab at the bottom of the screen to open the tour guide. Each image highlights a tours or place of interest in the area you are looking. Click on an item and you will be flown there. As you fly in and around the sites, snippets from Wikipedia provide additional information about the location. It’s like having a local expert right beside you!
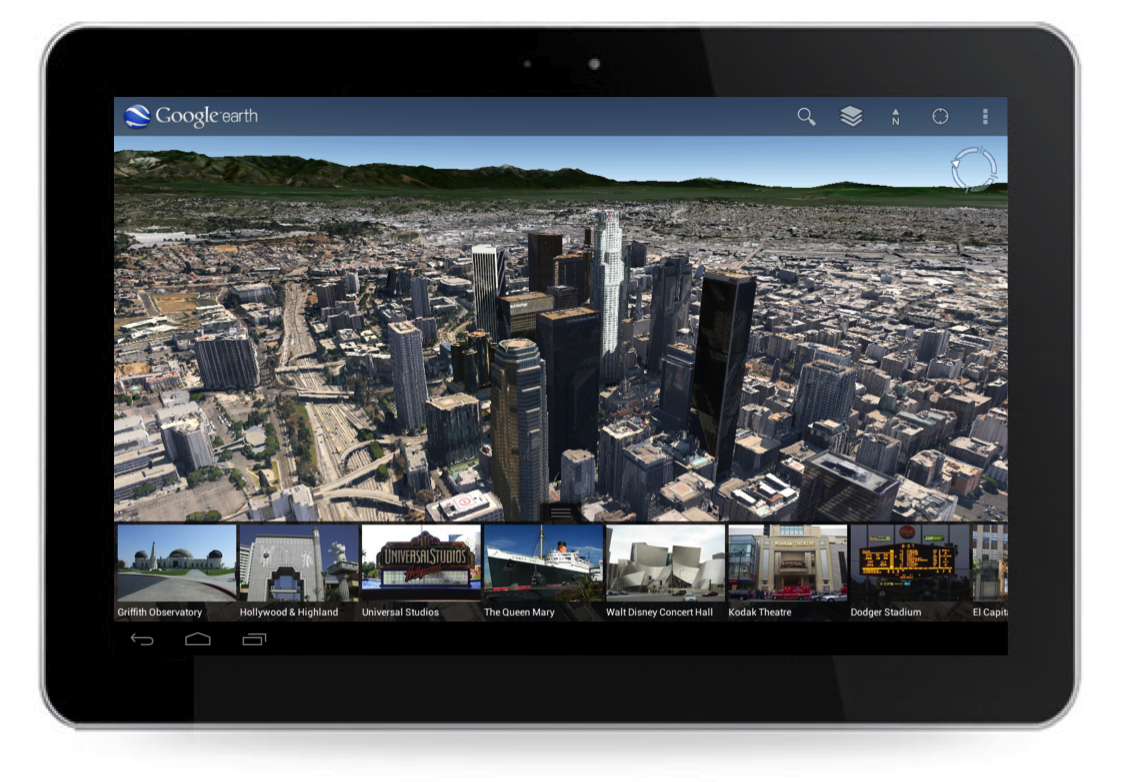
Tour guide showing top destinations around Los Angeles.
We hope this more accurate, comprehensive and realistic 3D representation of the Earth brings out the inner explorer in you. Whether you are visiting familiar grounds or venturing out into the world, Google Earth is there to show you the way.