Explore our U.S. Presidents on a map

When I was in elementary school, I got two days off every February; one for George Washington and another for Abraham Lincoln. I remember classrooms were usually wallpapered with a potpourri of decorations left over from Valentine’s Day and token silhouettes of these two Presidents thumb-tacked to the bulletin board. My teachers would talk about the significance of the holiday during class but with lack of visuals to pique my interest, it was always hard to retain (and fully enjoy!) the information. With that in mind, we’re pleased to celebrate the President’s Day holiday in the U.S. by letting you go back in time to learn more about our past presidents in a visually fun and interactive way.

We’ve created a U.S. Presidents Showcase to map the birthplaces of all 44 presidents, and provide details about their presidential terms, using the Google Earth plug-in. You can also see the states that voted during each president’s election by clicking on the tours in the left column of the showcase.


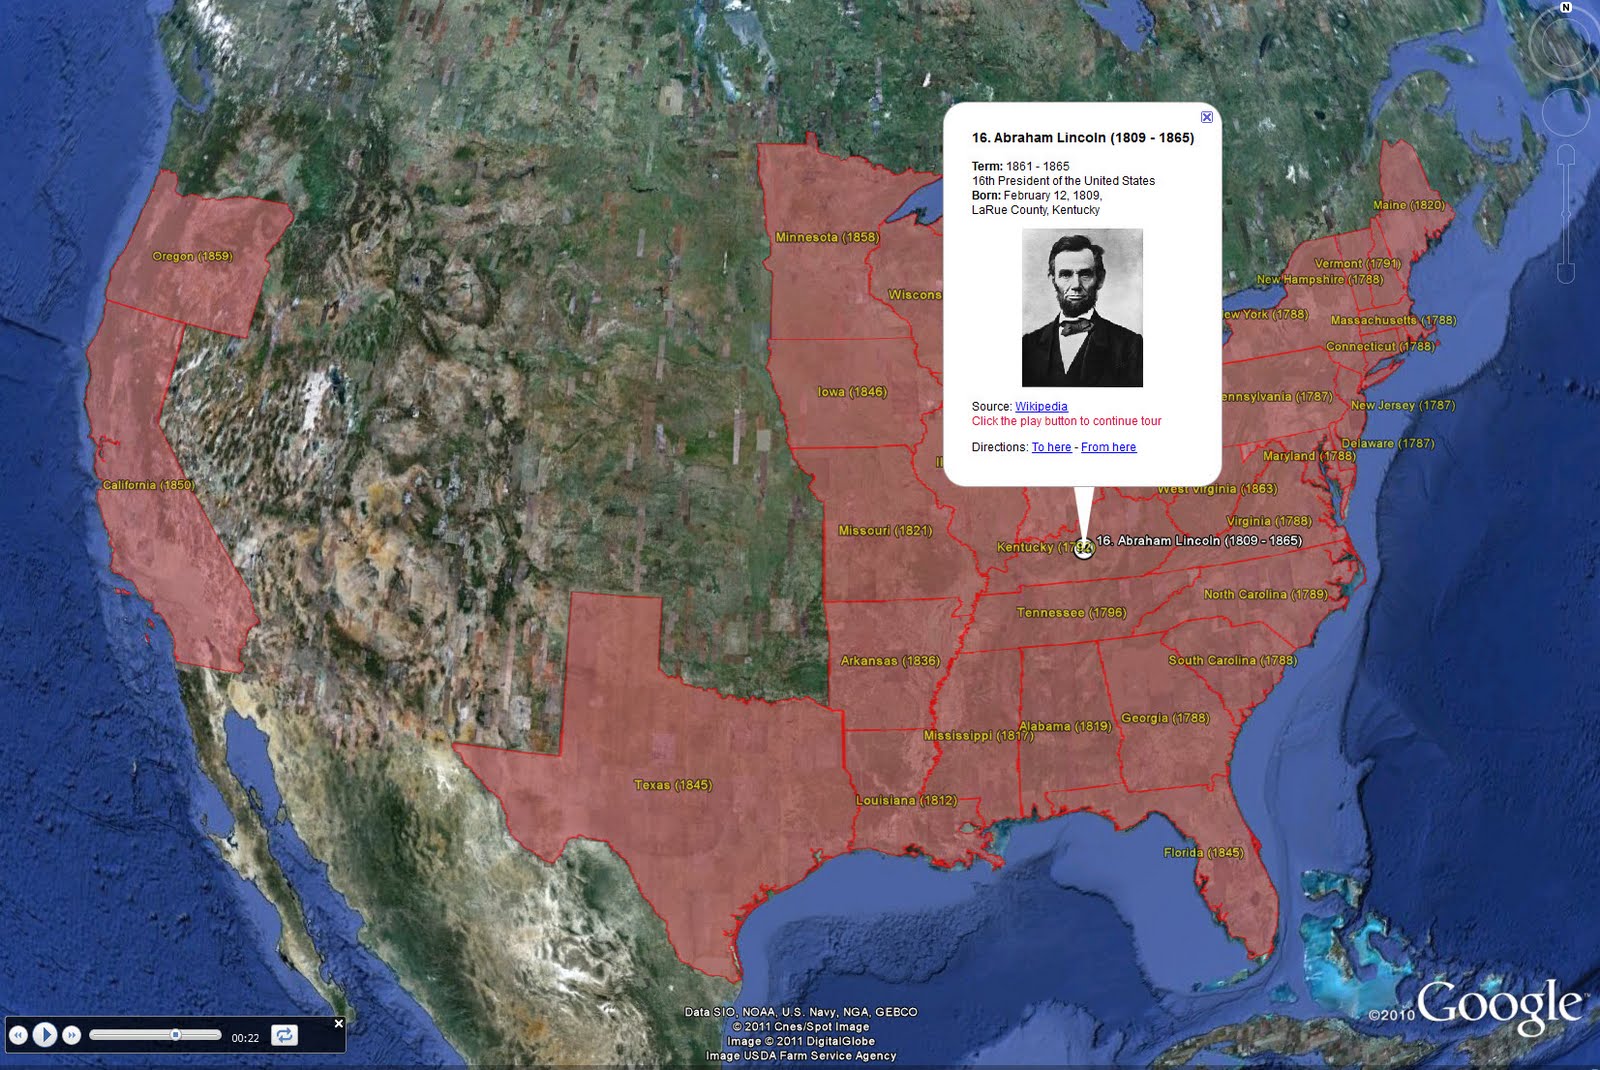
Whether you’re a history buff or simply curious to learn more about U.S. presidents, we hope you enjoy exploring a little further using Google Earth. In addition to the U.S. Presidents map, educators can use some of our other resources in their classroom to explore more aspects of history. Here are a few ideas:

  • Explore the White House, Washington Monument, Lincoln Memorial and other historical monuments in 3D and have students explain how architecture is used to honor people, concepts and establishments
  • View a 3D model of Valley Forge National Park in Google Earth
  • View a copy of the Emancipation Proclamation signed by Abraham Lincoln and map the areas where slavery ended, as well as the areas that were not initially covered by this executive order
  • Discuss the famous painting “Washington Crossing the Delaware” by German American artist Emanuel Gottlieb Leutze and use the ruler tool in Google Earth to measure the width of the Delaware River

We hope you have fun exploring and learning a little more of the history behind the President’s Day holiday. And when you’re done, go out and enjoy your day off!

No copyright on databases and maps?

Telstra’s Sensis has just lost an appeal with regard to Federal Court judgement that said its White and Yellow pages are not protected by copyright law. The key to the decision was that those compilations lack “creative spark” and hence cannot be protected under copyright law that requires “independent intellectual effort” to create the works. This ruling has important implications for all kinds of factual data collections, including listings of real estate, names and addresses or… databases with map data. Sensis will be seeking leave to appeal to the High Court to revert the decision.

It begs an interesting question: does it mean that all that high resolution imagery of your neighbourhood and representation of local roads, or cadastre boundaries, or geocoded addresses, are “free for all”? Google and others who publish such information would have no legal grounds for preventing people from copying it all in droves…

Life after Google Summer of Code

My name is Oscar Castañeda, I am a student from Guatemala currently doing a master’s in Computer Science at Delft University of Technology (TU Delft) in The Netherlands. For the 2010 Google Summer of Code I completed a project with the Google Open Source Programs Office as my mentoring organization and professor Michel van Eeten (TUDelft) and Nitin Bhide (Founder SVNPlot) as my project mentors.

In my research I study behavior in code production for all open source projects in the Apache Software Foundation (ASF) from 2004 to 2009, and this research was the subject of my Google Summer of Code project. I contributed to SVNPlot, a tool that creates various type of graphs and statistics from Subversion logs. My contributions enable SVNPlot users and developers to generate networks of file co-authorship that can be used to study behavior in code production, like the graph below which shows code production in the Apache Hadoop community and sub-communities in 2009.

After having finished my project in August, one remaining goal I had was to give a talk about my project, so presenting at ApacheCon NA this year was a good opportunity to accomplish that task.

I was able to travel to Atlanta and attend ApacheCon thanks to sponsorship from the ASF’s Travel Assistance Committee (TAC). The experience has been outstanding and packed with lots of fun. Other students and open source enthusiasts from all over the world were also sponsored by the ASF. We assembled into what became known as the “TAC Team.” As part of the TAC Team, we were in charge of chairing conference sessions, hosting Meetups and helping out behind the scenes. Best of all, we could attend the full conference and all the fun events that followed.

For me the experience was particularly interesting because I met many of the committers that power the ASF. Having done research on how ASF developers organize into communities, attending ApacheCon allowed me to put faces to usernames several times.

My challenge at ApacheCon was to give a talk to the very people whose code production behavior I had studied. The approach I took was to practice, practice, practice.

BarCamp offered an initial ice breaker in the preparations for my talk. The unconference style of BarCamp made it easy to propose a topic to talk about for 30 minutes. I simply posted a sticky note on the white board with the title “What is Meritocracy?” As soon as my slot started I noticed that BarCamp would be an interesting experience. Rather than just a presentation, the BarCamp talk I had proposed turned into an active exchange of ideas where I received many challenging questions.

Chairing conference sessions also helped me prepare for my talk. As session chair I was introducing speakers and assisting them with time management. In addition, I was sitting in on sessions, and seeing the speakers present helped me get into the flow of speaking at a conference. I found extraordinary examples in talks on Hadoop, Tuscany, and Mahout. And finally, the day came for me to present.

I was scheduled for the first morning session in the community track. It was a pleasant surprise to see that over 30 attendees showed up for my talk. All of them were well-prepared with mugs full of coffee, ready to listen to my morning talk. And in the end I found that practice does pay off. I wasn’t nervous and felt confident giving my presentation, a feeling that was reinforced when I saw that the audience was actually awake! However, deeper into the session I lost track of time. Luckily a fellow TAC team flashed the 20 minutes card, showing me that I could finish all my slides and still leave time for questions. The slides and a recording of my talk are available for those who want to know more.

Overall the experience has been very gratifying. I met lots of interesting people and learned more about open source and new developments there from the developers themselves. I highly recommend future Google Summer of Code students to consider including presenting their project at a conference as one of their project goals.