The concept of relative socio-economic advantage or disadvantage is neither simple, nor well defined. Australian Bureau of Statistics attempts to quantify socio-economic diversity for geographic locations with a suite of four summary measures called Socio-Economic Indexes for Areas (SEIFA).
The four indexes in SEIFA 2006 are:
Index of Relative Socio-economic Disadvantage: is derived from Census variables related to disadvantage, such as low income, low educational attainment, unemployment, and dwellings without motor vehicles.
Index of Relative Socio-economic Advantage and Disadvantage: a continuum of advantage (high values) to disadvantage (low values) which is derived from Census variables related to both advantage and disadvantage, like household with low income and people with a tertiary education.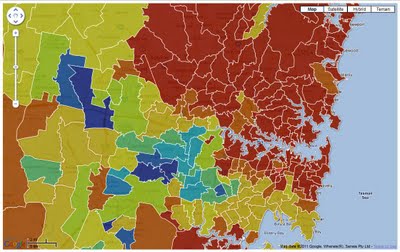
Index of Economic Resources: focuses on Census variables like the income, housing expenditure and assets of households.
Index of Education and Occupation: includes Census variables relating to the educational and occupational characteristics of communities, like the proportion of people with a higher qualification or those employed in a skilled occupation.
While SEIFA score represents an average of all people living in an area, SEIFA does not represent the individual situation of each person. Larger areas are more likely to have greater diversity of people and households.
A SEIFA score is created using information about people and households in a particular area. This score is standardised against a mean of 1000 with a standard deviation of 100. This means that the average SEIFA score will be 1000 and the middle two-thirds of SEIFA scores will fall between 900 and 1100 (approximately).
To determine the SEIFA rank, all the areas are ordered from lowest score to highest score. The area with the lowest score is given a rank of 1, the area with the second-lowest score is given a rank of 2 and so on, up to the area with the highest score which is given the highest rank, being 2615 for a postal areas (POA) index.
Deciles divide a distribution into ten equal groups. In the case of SEIFA, the distribution of scores is divided into ten equal groups. The lowest scoring 10% of areas are given a decile number of 1, the second-lowest 10% of areas are given a decile number of 2 and so on, up to the highest 10% of areas which are given a decile number of 10.
For more information about SEIFA and its potential uses please refer to the following document: 2039.0 – Information Paper: An Introduction to Socio-Economic Indexes for Areas (SEIFA), 2006
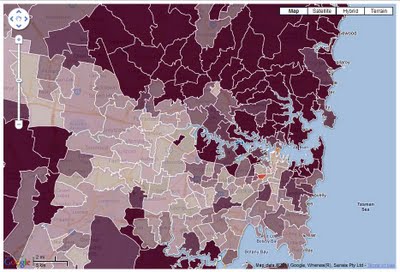
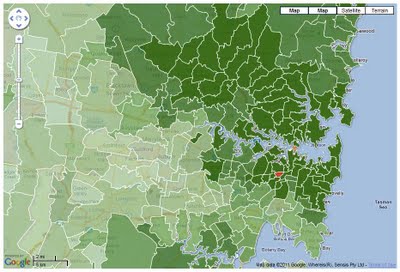
Data tables and maps are available for reference and further reuse via Google’s Fusion Tables:
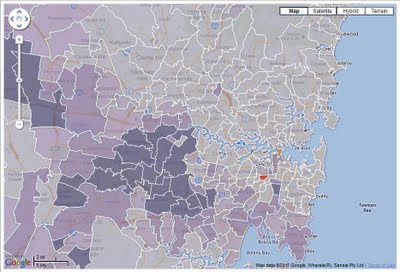
SEIFA 2006 for NSW Index of Disadvantage
SEIFA 2006 for NSW Advantage-Disadvantage
SEIFA 2006 for NSW Economic Resources
SEIFA 2006 for NSW Education-Occupation
SEIFA for Postal Areas Census 2006 (data table)
Postal Areas NSW Census 2006 Edition (postal area boundaries)