The Google Earth and Google Maps Imagery Team has just published its first batch of satellite and aerial imagery for June, and as always, there are all kinds of fascinating sites and features to check out.
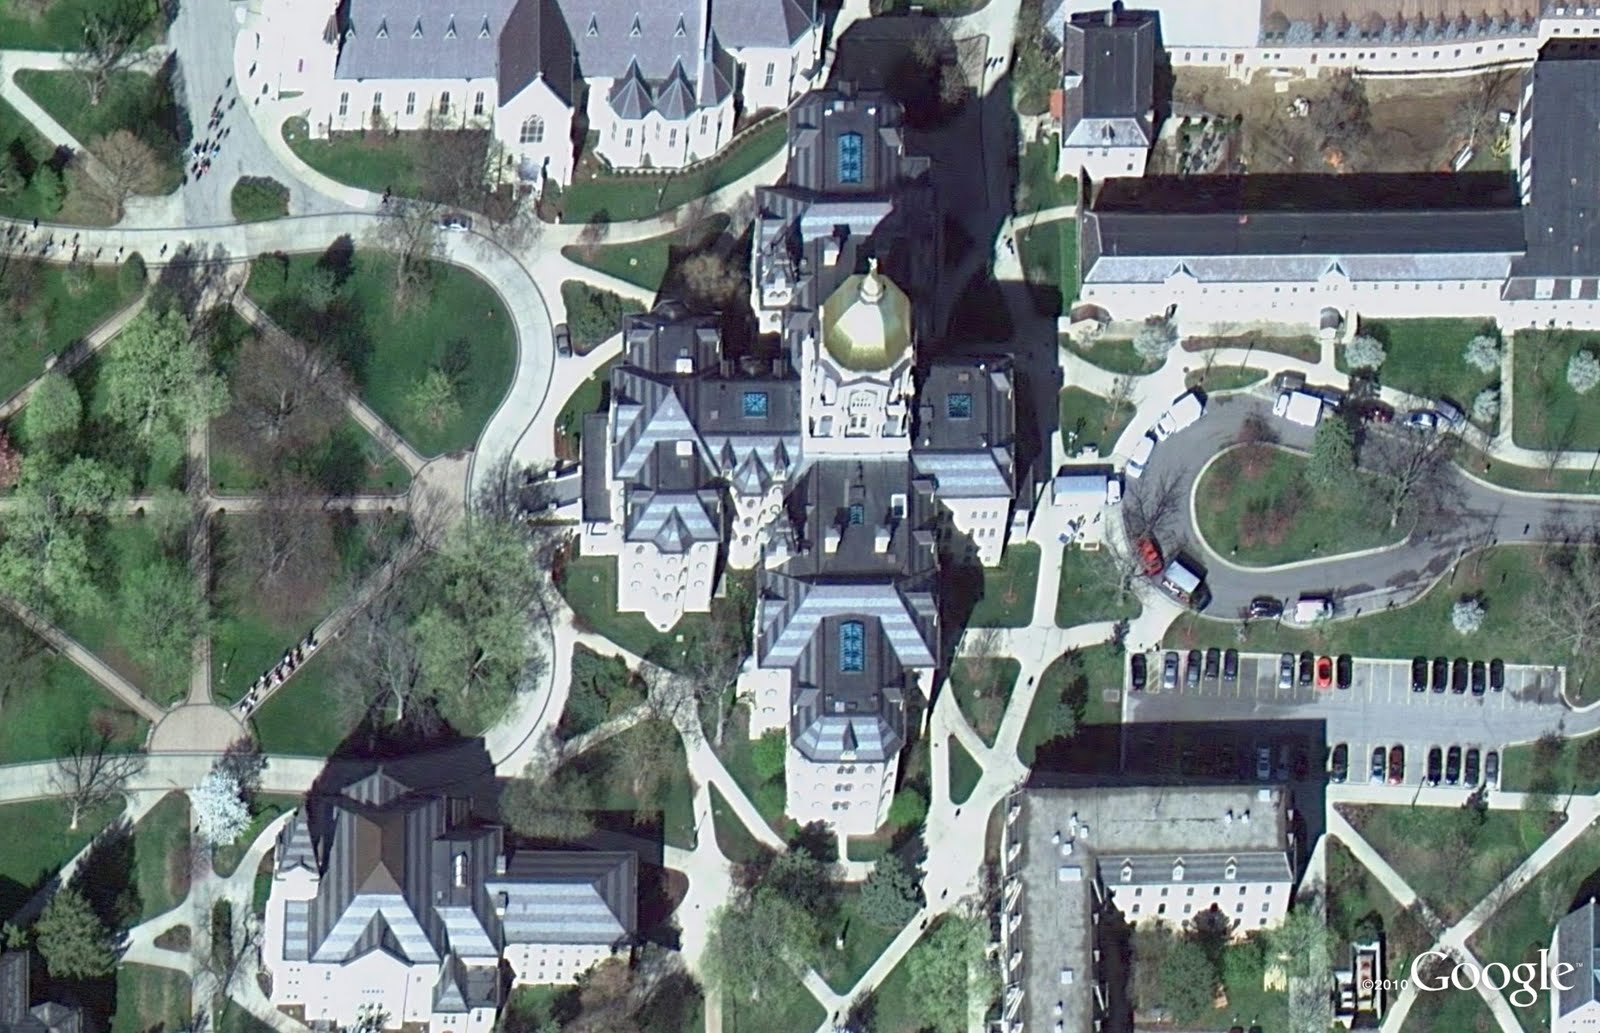
Our first example image shown below is of the Sacred Heart church and its famous gilded dome located on the Notre Dame campus in Notre Dame, Indiana. A church has continuously occupied this site since 1830 and the current basilica foundation was laid in 1868. This aerial imagery was acquired in late April, 2011.
Basilica of the Sacred Heart, University of Notre Dame, Notre Dame, Indiana
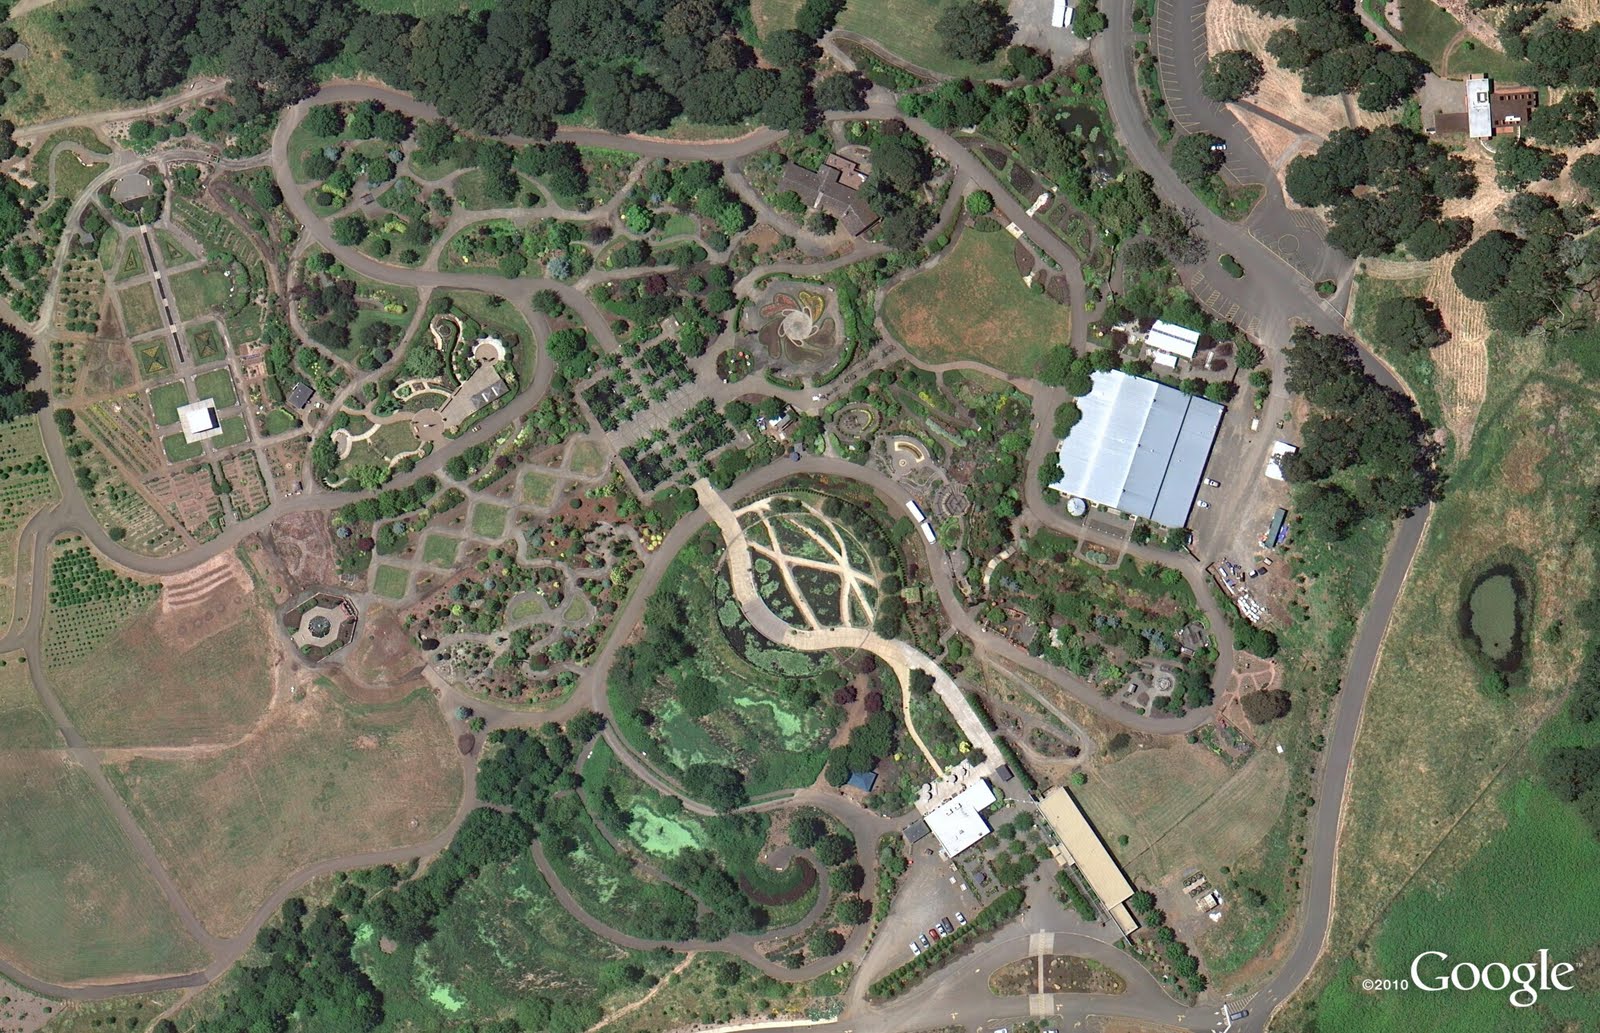
When you’re done checking out the beautiful Notre Dame campus imagery, zoom over to Oregon and explore our new aerial imagery of the Salem region acquired this past summer. Below is a section of the Oregon Garden, a botanical garden located in Silverton. In the upper-right corner, you can see the only Frank Loyd Wright building in the state, the Gordon House. This home is listed on the National Register of Historic Places and was envisioned as a model of affordable homes for the local working-class citizens.
Oregon Garden, Silverton, Oregon
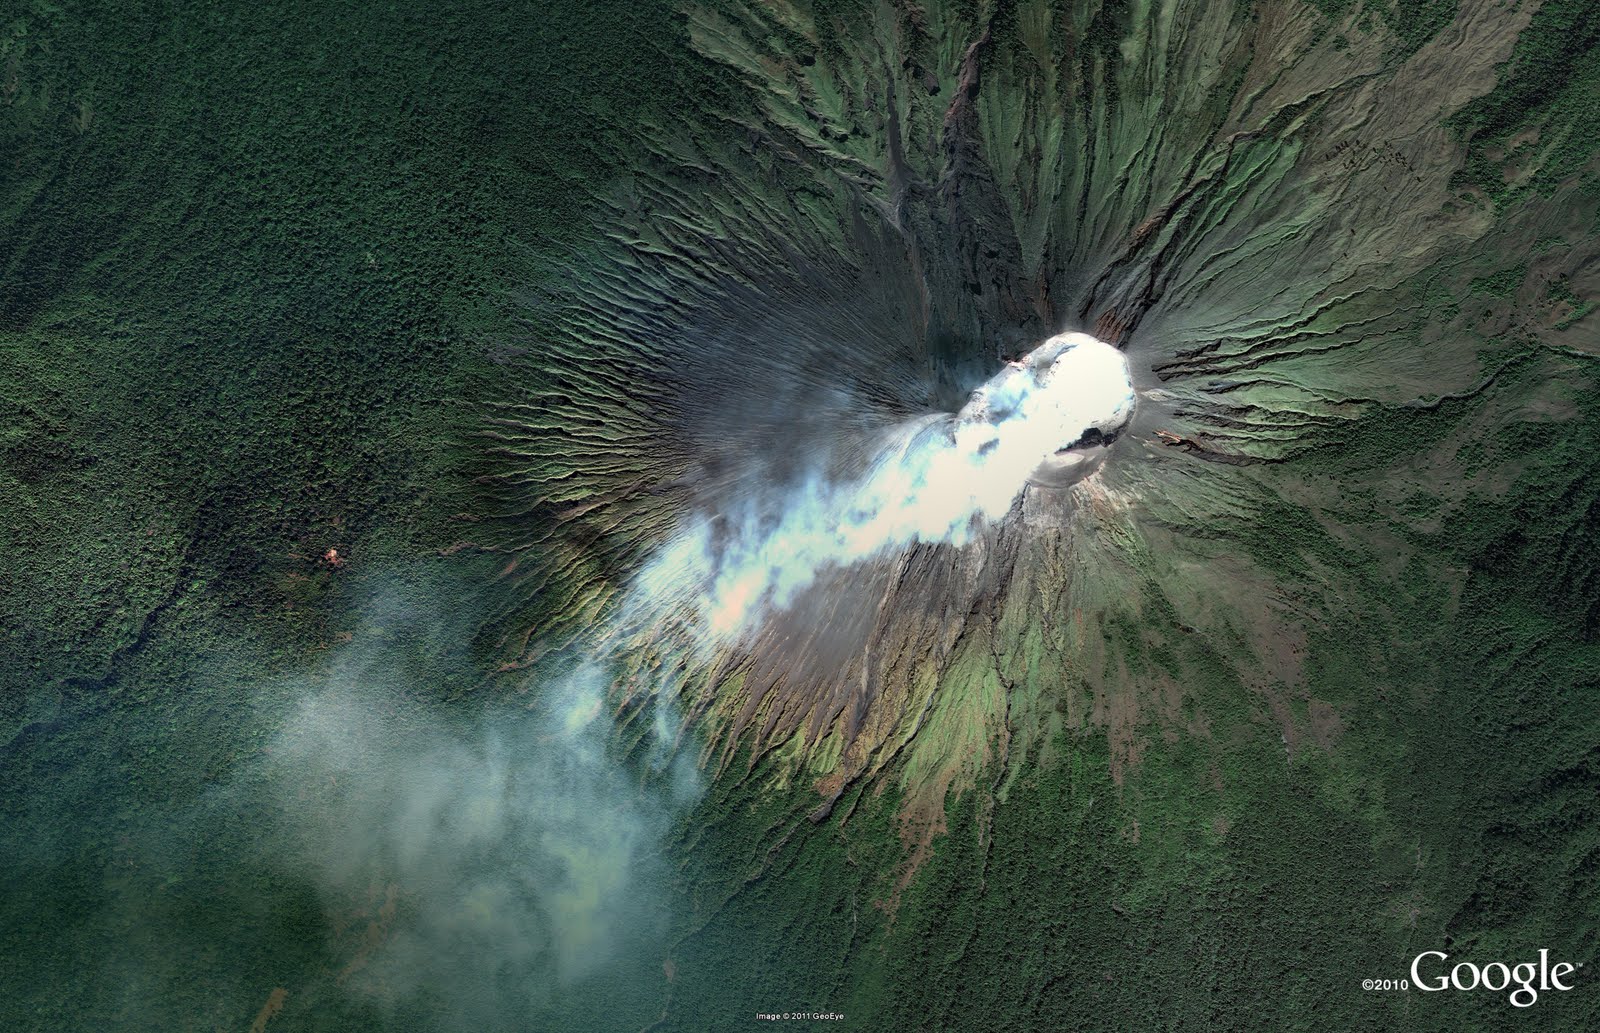
Finally, here’s a satellite image taken in December 2010 of the San Cristóbal Volcano. This active volcano rises above the town of Chichigalpa, locted in Chinandega, Nicaragua. In the image, you can see the gas and ash clouds emanating from the volcano’s caldera. These clouds and prevailing winds have served to remove all vegetation from the volcano’s southwestern flank.
San Cristóbal Volcano, Chichigalpa, Chinandega, Nicaragua.
Do you have a place you love for which you’d like to receive a notification when the Earth and Maps Imagery team updates the site? We’ve got just the tool: The Follow Your World application!
As always, these are but a few examples of the types of features that can be seen and discovered in our latest batch of published imagery. Happy exploring!
High Resolution Aerial Updates:
Fresno, CA; Huntington, WV; Laredo, TX; Los Angeles, CA; Manchester, NH; San Francisco Peninsula, CA; Salem, OR; Soldotna, AK; Southbend, IN; Sumter, SC; Victoria, TX.
Countries/Regions receiving High Resolution Satellite Updates:
Albania, Algeria, Argentina, Australia, Azerbaijan, Bahamas, Benin, Bolivia, Botswana, Brazil, Burkina Faso, Cambodia, Cameroon, Canada, Cape Verde, Chad, Chile, China, Colombia, Costa Rica, Croatia, Cuba, Democratic Republic of the Congo, Dominican Republic, Ecuador, Egypt, Eritrea, Ethiopia, Fiji, France, French Guiana, French Polynesia, Ghana, Greece, Guadeloupe, Guatemala, Honduras, India, Indonesia, Iran, Israel, Italy, Japan, Jordan, Kenya, Lebanon, Lesotho, Madagascar, Mali, Mauritania, Mauritius, Mexico, Moldova, Mongolia, Morocco, Mozambique, Myanmar (Burma), Namibia, Nepal, New Caledonia, New Zealand, Nicaragua, Niger, Nigeria, Norway, Oman, Pakistan, Papua New Guinea, Paraguay, Peru, Philippines, Poland, Romania, Russia, Saudi Arabia, Senegal, Serbia, Seychelles, Singapore, South Africa, South Korea, Sri Lanka, St. Helena, Sudan, Syria, Taiwan, Tanzania, Thailand, Togo, Tonga, Trinidad and Tobago, Turkey, Ukraine, United Arab Emirates, United Kingdom, United States, Uruguay, Venezuela, Vietnam, West Bank, Western Sahara, Yemen, Zambia.
These updates are now available in both Google Maps and Google Earth. To get a complete picture of where we updated imagery, download this KML for viewing in Google Earth.