The Hurricane Irene did more than $10 billion in damage


While Hurricane Irene didn’t strike the United States with as much force as many had predicted, it was still a substantial storm that claimed 54 lives and did more than $10 billion in damage.

GEB reader Noel has taken some of the imagery from NOAA’s Hurricane Irene Project Index Page and assembled them as image overlays in Google Earth. Some of the the imagery is quite striking, such as this image of a section of Highway 12 being washed away on North Carolina’s Outer Banks.


road.jpg 

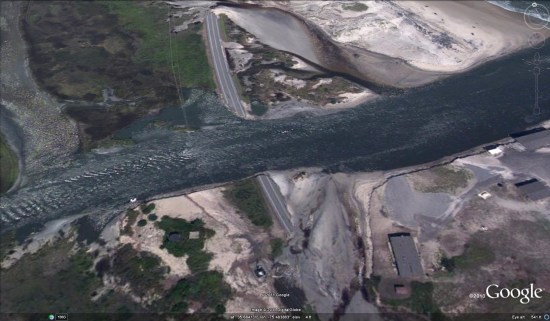
Highway 12 is the only road that connects Hatteras Island to the mainland, and this destruction has left 2,500 residents stranded on the island. There is an emergency ferry now in place to shuttle emergency personnel to and from the island, and no injuries have been reported.

Google Earth: Joplin’s tornado 3D model

Not long ago, we showed you some fresh imagery from Joplin, MO, after they were hit by that devastating tornado.

Steve Ansari from NOAA’s National Climatic Data Center (NCDC) recently sent us an amazing file that shows debris from the tornado in a 3D model!

Joplin-MO-20110522-Tornado-Event.jpg


You can view it yourself using this KMZ file.

A report was recently released from NCDC which gives a summary on the Joplin event and includes a flash movie showing the visualization in Google Earth.

The software used to create the KMZ file is the NOAA Weather and Climate Toolkit, which is developed at NCDC.

Here is a bit more about how this works, in Steve’s words:

The Radar site conducts conical sweeps at increasing elevations off the ground and measures the ‘reflectivity’ of particles in the atmosphere. Large rain drops, hail, and in this case debris are represented as high reflectivity values and it is ‘reflectivity’ which we are most accustomed to seeing on television and internet weather maps. Each sweep is represented as a COLLADA model with the semi-transparent Reflectivity image draped on the model. In addition, several isosurfaces are created from the 3D reflectivity volume and represented as polygons in the KML. A tour is also included in the KMZ.

Visualizing the vast problem of marine debris

mdc.jpgWith the fifth international Marine Debris Conference taking place this week in Hawaii, Google and NOAA (the National Oceanic and Atmospheric Administration) have put together some resources to help visualize this growing problem. The conference aims to help provide tools and information, as well as to inspire innovation.

To that end, Google and NOAA have built a tour to showcase some of the major problems our oceans are facing, as well as the main sources of marine debris around the world. To view the tour, you can view the tour in the Ocean Gallery, download it as a KMZ file, or watch the video below:

For more, check out the Google Lat Long Blog or the official NOAA website.