Sketchup:The Fat Pencil Studio

The company name “Fat Pencil” refers to the traditional drawing instrument used by architects during the early stages of conceptual design—when it’s important to get ideas on paper quickly, and avoid getting bogged down by details. Google SketchUp Pro provides a digital equivalent of this practice, and it’s been an essential tool for us since Fat Pencil Studio was founded in 2004.

Fat Pencil Studio creates technical graphics for legal, transportation, and construction professionals. Some examples are courtroom exhibits, infrastructure visualization and site logistics diagrams. Our staff have engineering and architecture backgrounds. We use this experience to develop compelling visual presentations for complex projects.

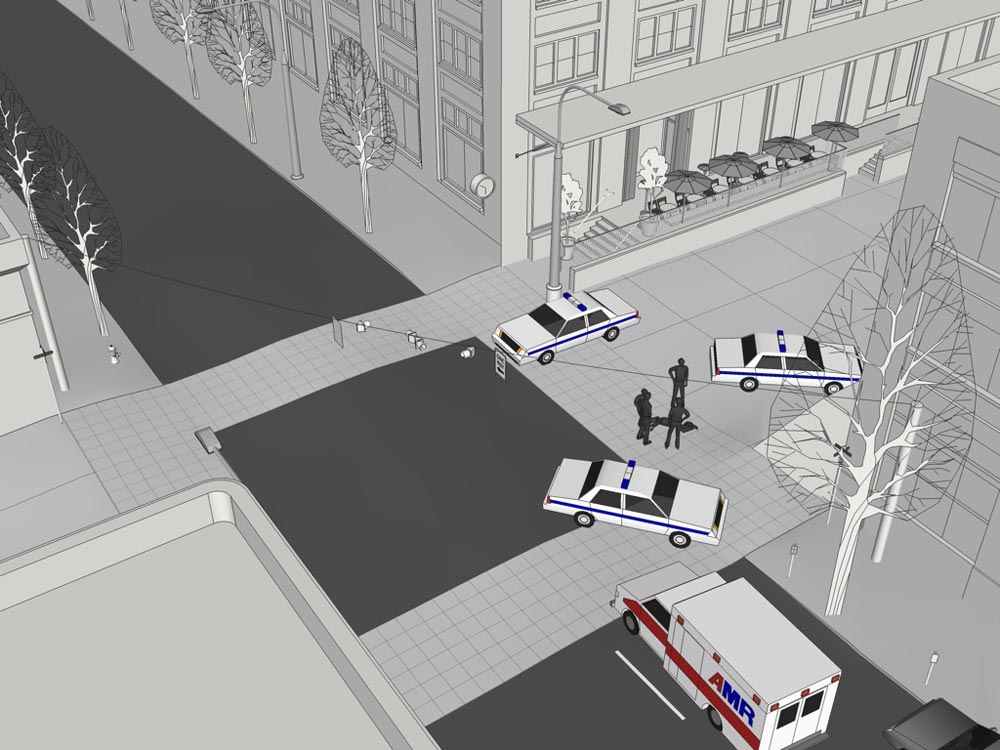
This trial exhibit is designed to allow witnesses to identify their vantage point in a birds-eye view, and then zoom to a street-level perspective using the Position Camera tool.
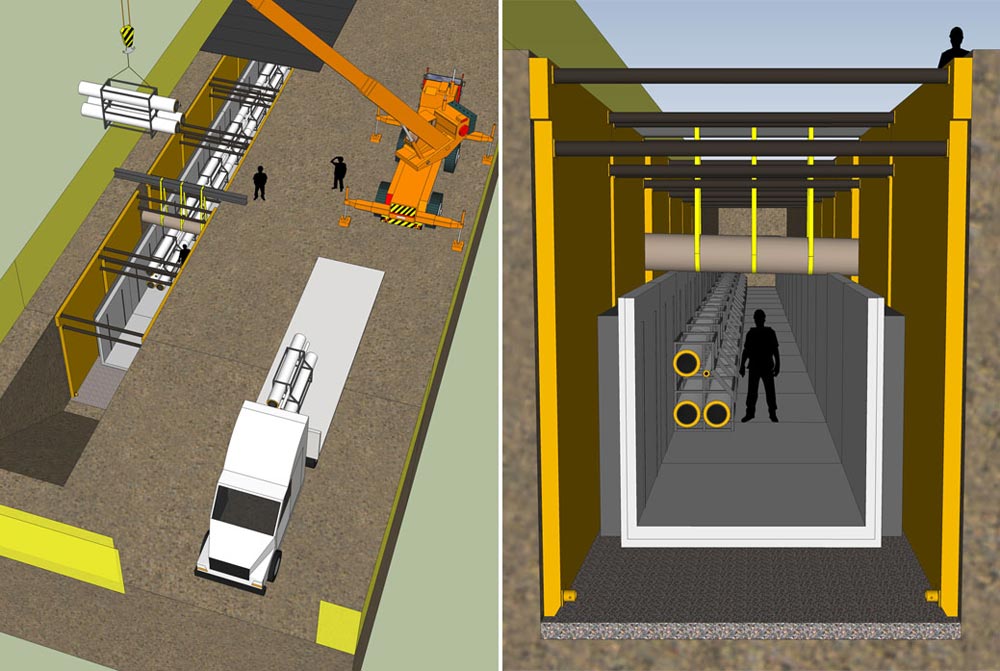
In this construction diagram, pre-assembled pipe sections are lowered into a utility tunnel.

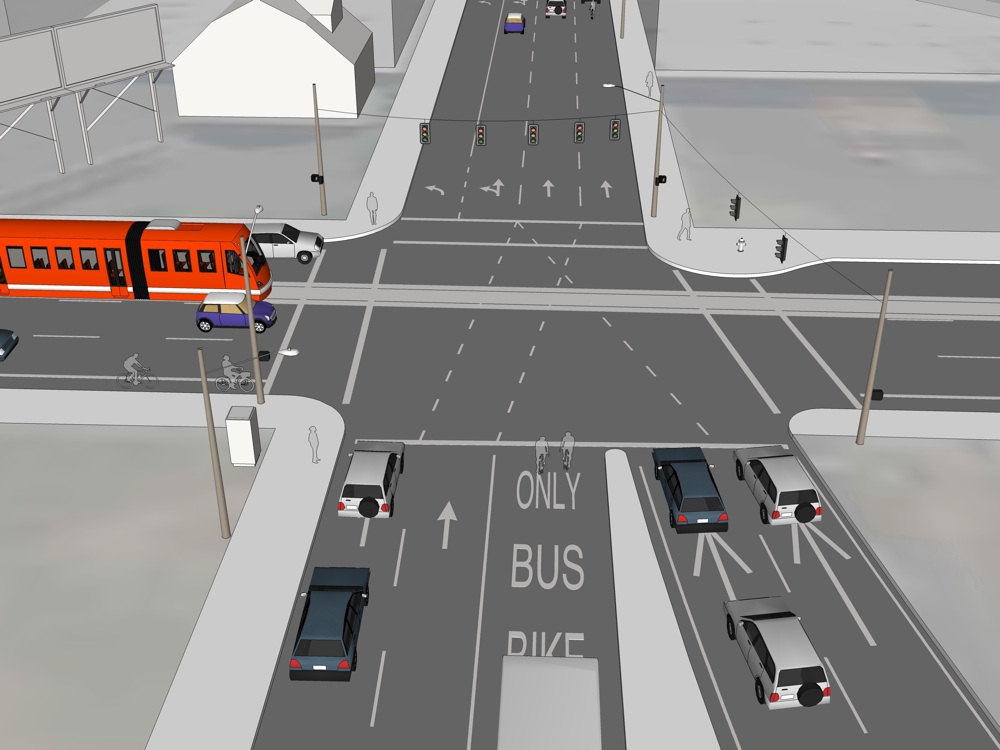
Last year, we helped the City of Seattle visualize the reconfigured Broadway and Jackson Street intersection along the proposed alignment for the First Hill Streetcar extension. URS (the prime contractor for the project) had already developed 2D design drawings in AutoCAD. They needed 3D perspectives for public stakeholder meetings and regulatory filings. Once the model was created, Alta Planning (another member of the design team) was able to use it as a design tool. Each intersection could now be seen from multiple perspectives: driving, cycling, and walking. This allowed Alta to identify and address safety issues related to a two-way Cycle Track proposed for the reconfigured street.

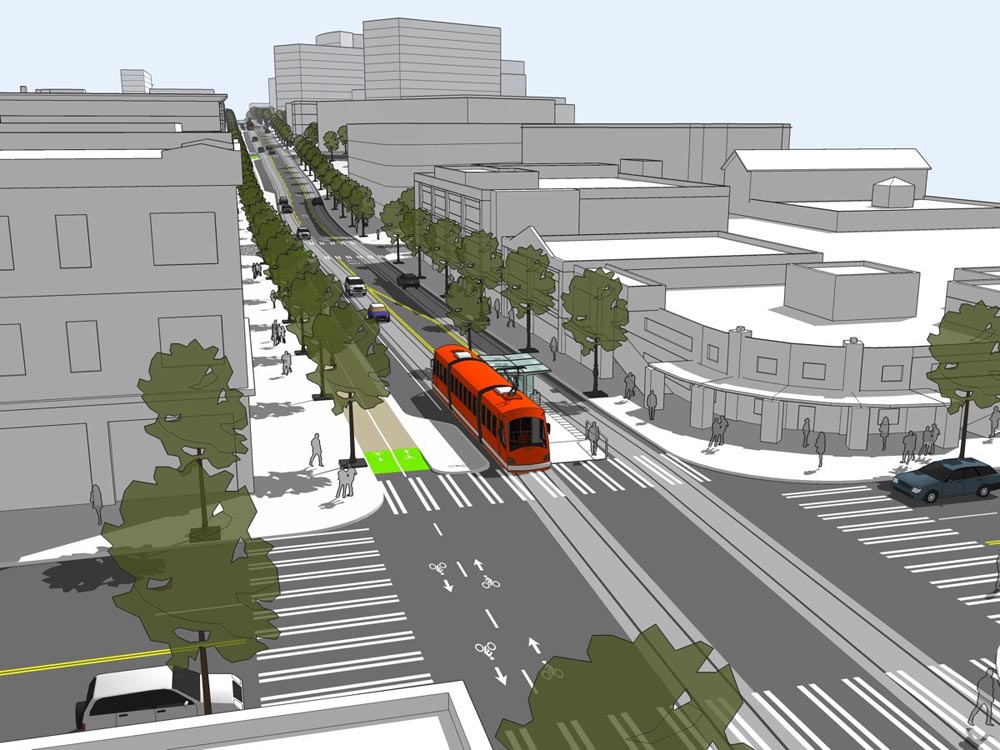
Aerial view of the proposed Broadway and Pike Street Station.

The buildings in this area of Seattle are already in Google Earth’s 3D Buildings layer, so we initially considered importing street features into Google Earth to create a presentation. However, the difficulty of matching terrain over such a large area forced us to scrap this plan. SketchUp Pro offers more flexibility for presenting the details that matter most in this project; namely, the new street configuration. After cleaning up the AutoCAD drawings, we draped the linework over imported terrain and then added 3D features. We used several plugins to help reduce modeling time: Projections V2 helped with the curbs. Drop and RepeatCopy helped us place trees, cars, bikes and people. We also had some help from the 3D Warehouse, including an excellent streetcar model by JediCharles.

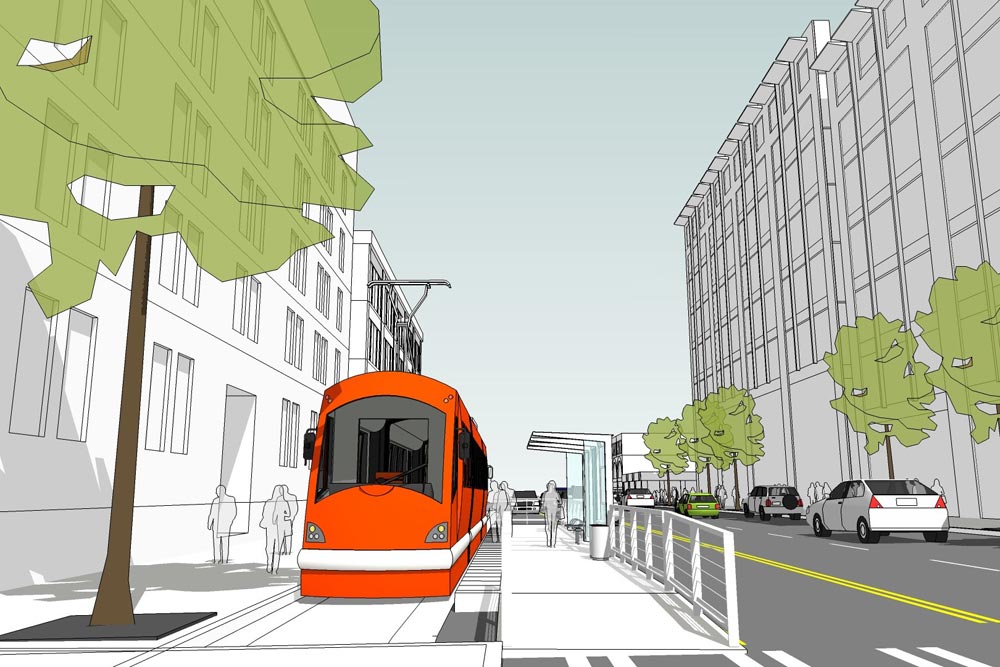
Street level view of the 2nd Avenue and King Street Station.

The streetcar project also gave us an opportunity to collaborate with another firm. IBI Group of Portland was responsible for station design and also modeling the southern half of the 2.5 mile streetcar alignment. Their half of the model was created in SketchUp on Windows, using terrain data from a street survey. Our half was modeled with SketchUp on a Mac, using terrain data from Google’s servers. The terrain matched almost perfectly at the seam, with only minor “smooving” needed. Using the combined model, we were able to generate dozens of still image views and several flyover animations.

Existing conditions at North Vancouver and Broadway in Portland, Oregon.
Turning on “Hidden Geometry” reveals the component segments used to build street markings.

Currently, we are working on a project to present options for safety improvements in a few sections of Portland’s extensive bikeway system. In this case we did not have detailed CAD drawings as a starting point; this gave us an opportunity to try a new approach for modeling street markings. Using high-resolution satellite images as a reference, we traced a single line along the center of existing markings. The PathCopy script allows us to “paint” the street markings as a series of components. Spacing can be configured for dashed lines, or set to zero for solid lines.

Test suite for rich text editing

Many web applications allow users not just to edit plain text, but also to embellish it – making it bold or underlined, adding bulleted lists or images. For example, think of online document or blog editors, or rich e-mail apps. JavaScript provides various APIs you can use to implement these apps.

Unfortunately, while these APIs are largely defined the same in modern browsers, the results often differ. To document the current state of all this, we have set up a new rich text editing test suite as part of the larger browserscope framework.

Let’s look at how a region of text, such as a

, can be marked as editable by adding the contenteditable attribute:

...some content...

You can then manipulate the content with simple calls:

document.execCommand("formatting command", showUI, parameter)

For example, you can set the color of the selected text to red with this call:

document.execCommand("forecolor", false, "red")

Although this command works well on most browsers, different browsers implement different subsets of formatting commands, and even common commands often produce varying HTML structures.

There are other APIs that affect selection and cursor movement, or allow querying of the current state, and those, too, are often implemented differently.

Our new test suite tries to capture all currently implemented commands and APIs, and runs them on varying initial HTML content and within various containers. The suite already contains well over 1,000 tests.

We don’t want to stop there. We intend to grow the suite and incorporate external feedback and suggestions so we can arrive at a common set of editing functions. We hope this can then serve as a common reference, not only for browser implementers, but also for web developers.

To achieve this goal, we would like input from anyone interested in this topic, including those with past complaints about bugs and incompatibilities in this area.

Bing Maps: Heat Mapping Crime Data and HTML5 Canvas

Crime data is frequently presented using “heat maps”. See, for example:

imagehttp://www.bbc.co.uk/truthaboutcrime/crimemap/ image http://www.zubedpi.com/

One of the reasons why heat maps are used to visualise crime data is that crimes are typically recorded as individual incidents, occurring at one particular location, yet we tend to want to think of areas at high- or low- risk of crime. We therefore need some way of aggregating those individual crime occurrences into regions that can be analysed.

It doesn’t necessarily make sense to create a thematic map of crimes based on geographic or administrative divisions – a burglar probably does not have much regard for whether he commits a crime in one polling district/ward/street of a city or another, for example, and we should not attempt to fit the distribution of crimes to such arbitrary regions. A heatmap creates a way of summarising and presenting a set of point data with the only influencing factor being the underlying geographic distribution of the points – a greater number of points in the same proximity leads to a “hotter” region.

Seeing as the government has just launched the http://www.police.uk/data portal providing access to a dataset of all reported crime in England and Wales (at a ridiculous cost of £300,000 for 40 basic CSV files, updated monthly), I thought that this would be a good opportunity to update my old heatmapping code to use Bing Maps AJAX v7. What’s more, seeing as Internet Explorer 9 now supports the element, I thought I’d try creating heat maps dynamically in the client-side browser rather than rendering them as images on the server-side, as I typically have done in the past.

To start with, I created an array of locations from which my heatmap would be created. I used all of the “anti-social behaviour” crimes reported by Norfolk constabulary during December 2010 (3,185 records). Having converted each record in the CSV file to a Microsoft.Maps.Location, my array looked like this:

[php]var locations = [
new Microsoft.Maps.Location(52.672802972383, 0.943923796417529),
new Microsoft.Maps.Location(52.624236498992, 1.29493956651563),
new Microsoft.Maps.Location(52.6218783667792, 1.29080178760268),

][/php]

I then created a element in my HTML page and placed it so that it exactly covered the

element in which my Bing map would be created:
[php]var canvas = document.createElement(‘canvas’);
canvas.id = ‘heatmapcanvas’
canvas.style.position = ‘absolute’;
canvas.height = 800;
canvas.width = 1024;
canvas.style.zIndex = 1;
document.getElementById(‘mapDiv’).lastChild.appendChild(canvas);[/php]

Note that, as Bing Maps v7 doesn’t have an AddCustomLayer() method as in the previous v6.x versions, I’m having to manually add the canvas element into the correct place in the DOM using appendChild(). This method is not perfect as it places the canvas on top of the map controls as well as the map tiles – I’m going to be looking at this issue later.

The next step is to loop through each of these locations and add a radial gradient at the appropriate pixel location on the canvas (which, because the canvas is placed exactly over the map, can be determined by the tryLocationToPixel() method). The appearance of each heat point produced is affected by two parameters – radius determines the extent to which heat spreads out around a point, and intensity determines how hot it is at the centre of each point.

[php]// Create the Intensity Map
for (var i = 0; i < locations.length; i++) {
var loc = locations[i];

// Convert lat/long to pixel location
var pixloc = map.tryLocationToPixel(loc, Microsoft.Maps.PixelReference.control);
var x = pixloc.x;
var y = pixloc.y;

// Create radial gradient centred on this point
var grd = ctx.createRadialGradient(x, y, 0, x, y, radius);
grd.addColorStop(0.0, ‘rgba(0, 0, 0, ‘ + intensity + ‘)’);
grd.addColorStop(1.0, ‘transparent’);

// Draw the heatpoint onto the canvas
ctx.fillStyle = grd;
ctx.fillRect(x – radius, y – radius, x + radius, y + radius);
}[/php]

To start with, I used values of radius 20 and intensity 0.25. This meant that the centre of any single point would be plotted as black colour with 0.25 transparency. The visibility of each point would gradually diminish to be fully transparent 20 (pixels) away from the centre. However, the heat of any points closer than 20 (pixels) to each other would create an additive effect, and produce a heat intensity map like this:

image

Having created a single-channel heat intensity map as above, you can then colourise it by creating a linear gradient, and mapping the alpha values of each pixel on the canvas to the appropriate value from the gradient.

The following code demonstrates a linear colour gradient that progresses from cool colours to hot colours, as typically used in a heat map:

[php]function createColourGradient() {
var ctx = document.createElement(‘canvas’).getContext(‘2d’);
var grd = ctx.createLinearGradient(0, 0, 256, 0);
grd.addColorStop(0.0, ‘magenta’);
grd.addColorStop(0.25, ‘blue’);
grd.addColorStop(0.5, ‘green’);
grd.addColorStop(0.75, ‘yellow’);
grd.addColorStop(1, ‘red’);
ctx.fillStyle = grd;
ctx.fillRect(0, 0, 256, 1);
return ctx.getImageData(0, 0, 256, 1).data;
}[/php]

And this colour gradient can be used to colour the intensity map as follows:

[php]      var dat = ctx.getImageData(0, 0, canvas.width, canvas.height);
var pix = dat.data;
var ColourGradient = createColourGradient();
for (var p = 0; p < pix.length;) {
var a = pix[p + 3]*4; // get the alpha value of this pixel
pix[p] = ColourGradient[a]; // get the red value from linear gradient that corresponds to this alpha
pix[p + 1] = ColourGradient[a + 1]; //get the green value based on alpha
pix[p + 2] = ColourGradient[a + 2]; //get the blue value based on alpha
p+=4; // Move on to the next pixel
}
ctx.putImageData(dat, 0, 0);

// Populate the canvas
ctx.fillRect(0, 0, 1024, 800);[/php]

The preceding code might need a bit of explanation…

  • Each pixel in the array returned by getImageData() is represented by 4 bytes of data, those bytes representing the Red, Green, Blue, and Alpha values of that pixel.
  • So, in the for loop above, the line pix[p+3]*4 is used to return the alpha value only of each pixel in the pix array. (Remember that the canvas was created by placing radialgradients around each point, which varied from an alpha of intensity at the centre to alpha of 0 at a distance of radius from the centre).
  • I then look up the pixel that lies at the equivalent position in the ColourGradient spectrum, and copy the first 3 bytes from it into the pixel array, replacing the purely black image with the Red, Green, and Blue values.

The result of colourising the map using the linear gradient defined above is as follows:

image

Of course, HTML5 makes it very easy to colour the heat map using any colour gradient you want. Changing the ColorStops in the linear gradient as follows, for example:

[php]grd.addColorStop(0.0, ‘black’);
grd.addColorStop(0.5, ‘red’);
grd.addColorStop(0.9, ‘pink’);
grd.addColorStop(1, ‘white’);[/php]

leads to the following:

image

There’s still a few issues I’m having with my code – namely trying to get the element inserted at the right place in the DOM to be above the map tiles but underneath the navbar (it seems that all elements in the AJAX v7.0 control are displayed at z-index:0, so I can’t use this as a method top position it). Also, whilst the code above works great in IE9 and Google Chrome, Firefox often gives me the “slow script” warning… I’m not sure what element it’s unhappy with, or whether it’s just that Firefox is not as HTML5-compliant as it claims to be… (ahh the joys of creating cross-browser web apps!)

If I get these issues ironed out, and if anybody shows any interest, then I might package up the complete heatmap code into a reusable class and pop it up on codeplex.