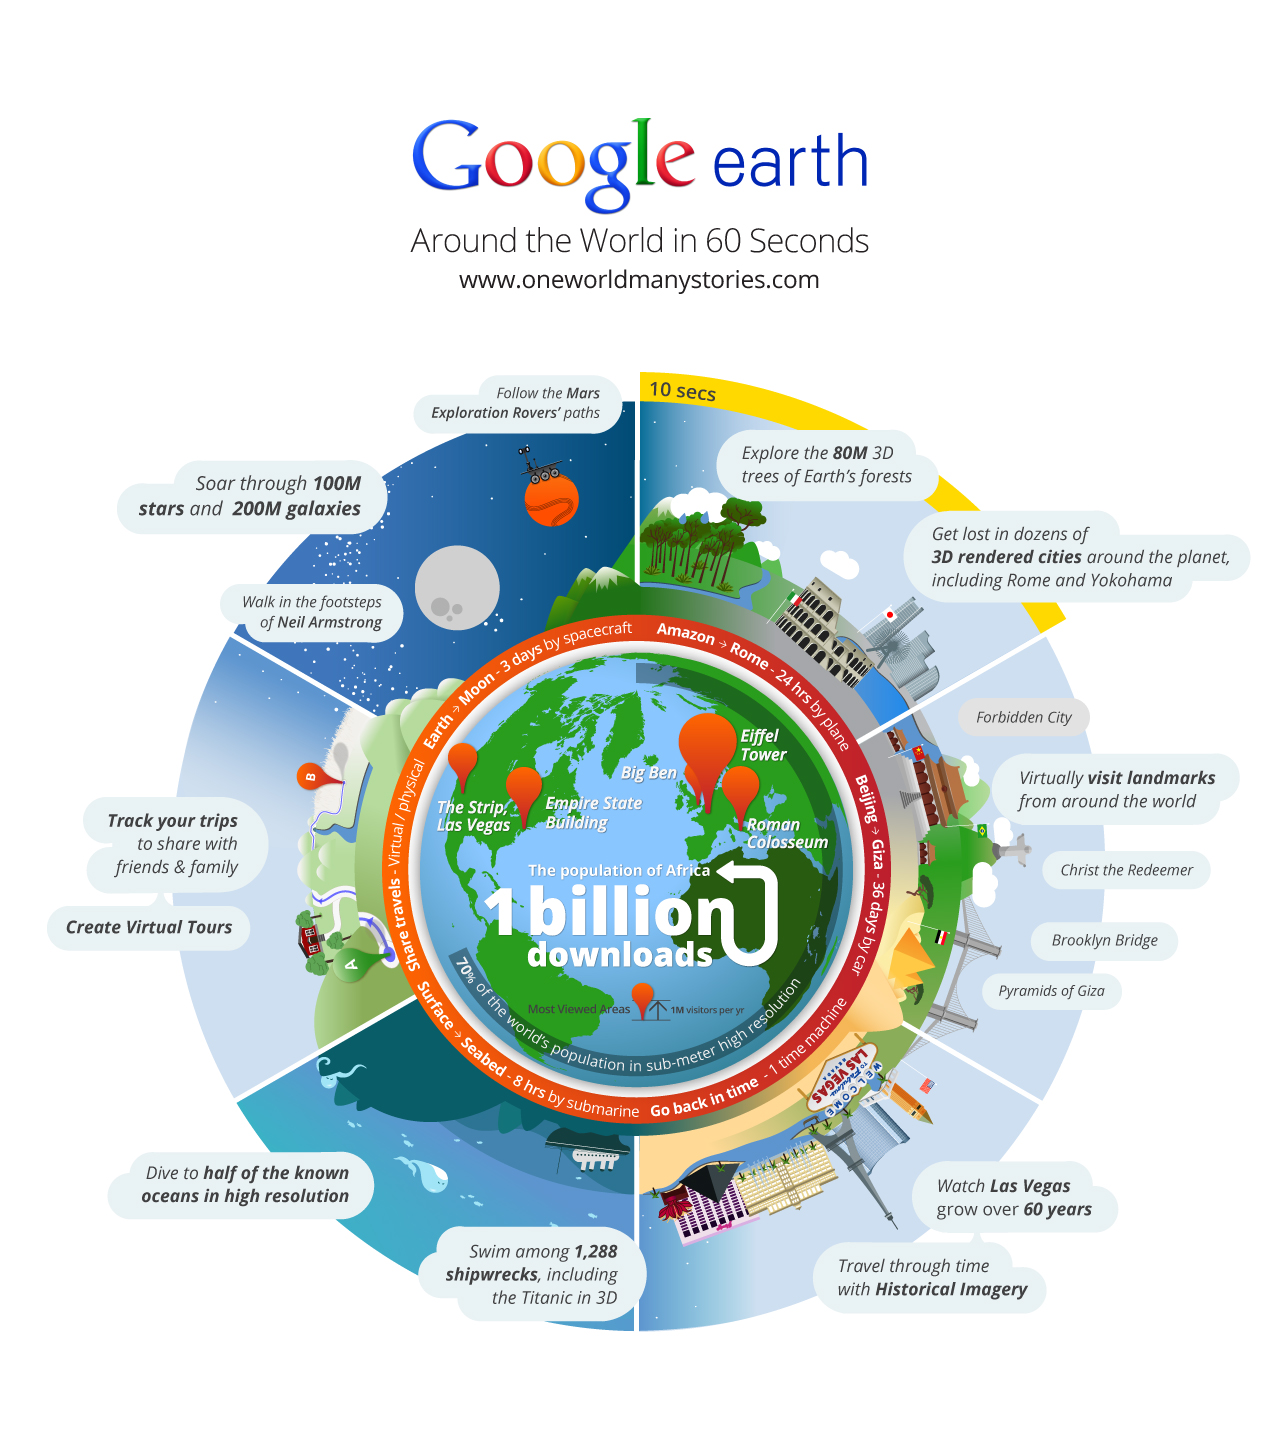
How large is one billion? One billion hours ago modern humans were living in the Stone Age. One billion minutes ago, the Roman Empire was flourishing. If you traveled from Earth to the Moon three times, your journey would measure one billion meters.
Today, we’ve reached our own one billion mark: Google Earth has been downloaded more than one billion times since it was first introduced in 2005. That’s more than one billion downloads of the Google Earth desktop client, mobile apps and the Google Earth plug-in—all enabling you to to explore the world in seconds, from Earth to Mars to the ocean floor.
We’re proud of our one billion milestone, but we’re even more amazed at the way people have used Google Earth to explore the world. When we founded Keyhole, Inc. back in 2001 (the company was acquired by Google in 2004), we never imagined our geospatial technology would be used by people in so many unexpected ways. At www.OneWorldManyStories.com, we’ve collected stories from people all over the world who use Google Earth to follow their dreams, discover new and distant places, or make the world a better place.
Visit www.OneWorldManyStories.com to learn about people like Professor David Kennedy of the University of Western Australia, who’s used Google Earth to scan thousands of square kilometers in Saudi Arabia and Jordan. Professor Kennedy has discovered ancient tombs and geoglyphs dating back at least 2,000 years, all without leaving his desk in Perth. Architect Barnaby Gunning, after the April 6, 2009 earthquake near L’Aquila Italy, encouraged his fellow citizens to start rebuilding the city virtually in 3D. Their online urban planning will aid city planners and architects. Retired English teacher Jerome Burg created Google Lit Trips, which uses Google Earth to match places in famous books to their geographical locations, encouraging students to create connections between the stories they read in school and the world they live in.
We hope you enjoy the site, and that it illustrates how some of those one billion downloads of Google Earth have been making a difference. You can explore these stories right in your browser with the Google Earth plug-in or download the KML files to view in Google Earth.
If you have a Google Earth story you’d like to share, we’d love to hear from you. If you don’t have Google Earth, download it now and be part of the next billion stories. While it’s inspiring to see how Google Earth has touched the lives of so many, we know the best is yet to come.
by Brian McClendon
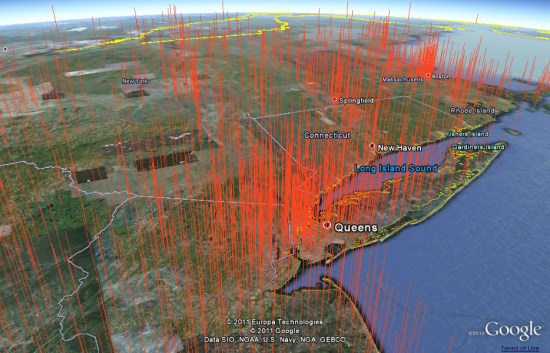
 uses transparent spheres with volumeric values, similar to the demos we have seen from DataAppeal in the past.