Google.org was using Google Earth to visualize Geothermal Data in the United States.
Google has continued to increase the amount of data behind the map, making it a more and more powerful tool as times goes on.
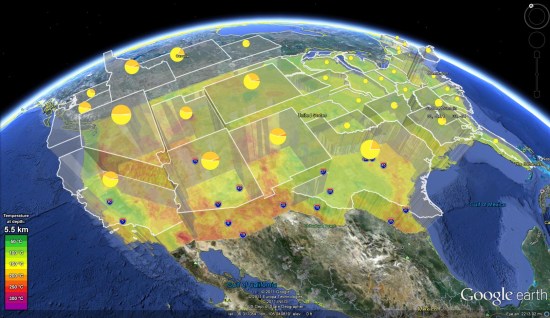
If you’re unclear on what Enhanced Geothermal Systems (EGS) are about, read this snipped from the Google.org EGS page:
Enhanced Geothermal Systems, or EGS, attempts to do just that. EGS produces heat and electricity by harnessing the energy from hot rock deep below the earth’s surface, expanding the potential of traditional geothermal energy by orders of magnitude. EGS is a big challenge, but with the potential to power the world many times over, it demands our immediate attention. At Google we support efforts to advance EGS through R&D, investment, policy and information.
To see this data for yourself in Google Earth, simply load this KMZ file (which was last updated just a few days ago). Also worth your time is this short article in Forbes that talks a bit more about how EGS could benefit all of us.
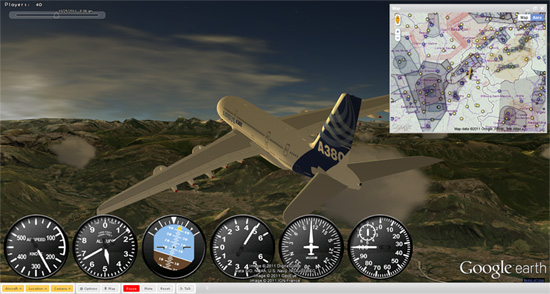

 In addition, the map is fully functional on mobile devices.