Great User Created Maps Chronicling Egypt

During the crisis in Egypt, third-party Geo developers helped the international community understand the situation and keep persons affected by the crisis safe through the use of innovative new tools. These same tools can be replicated by anyone in any crisis situation. In the developer examples below, three things jump out as particularly striking: How quickly these maps were built and put into action, some within hours of the first protests; how developers (many contributing independently) from all over the world worked together to get these maps up and running; and how geo-context has become extremely important for the international community in understanding and responding to any crisis, be it natural or man-made.

NY Times – Mapping the Protest in Cairo Day by Day

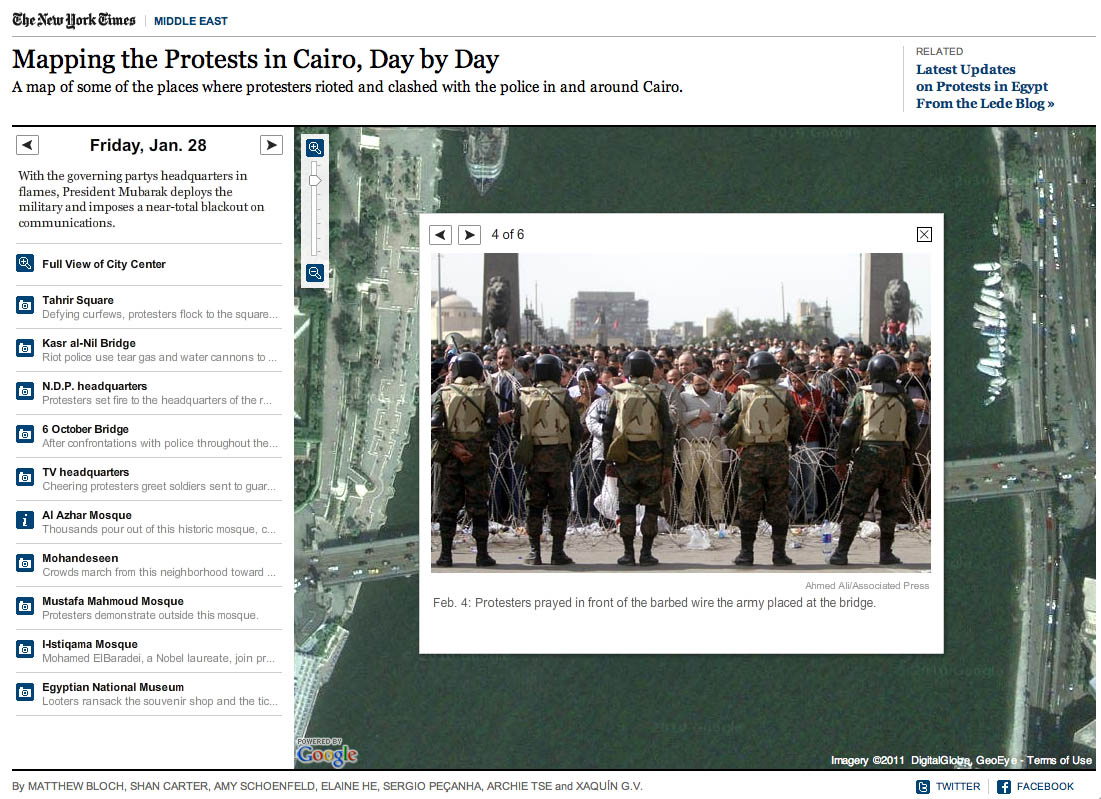
In this map, the New York Times has plotted the locations of the protests and clashes with police. There are also pictures, videos and contextual information provided in the icon info bubbles.

Al Jazeera – Mapping the Day of Wrath

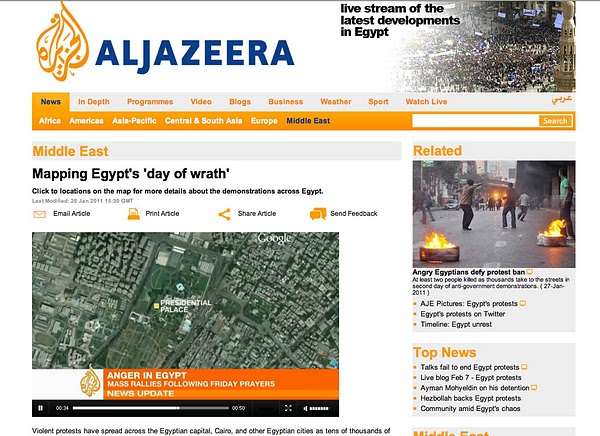
This website features a video illustrating the geographic spread of the protests using fly-over animations in Google Earth. The same webpage includes maps with information about protests in Cairo and throughout Egypt.

Hypercities Egypt

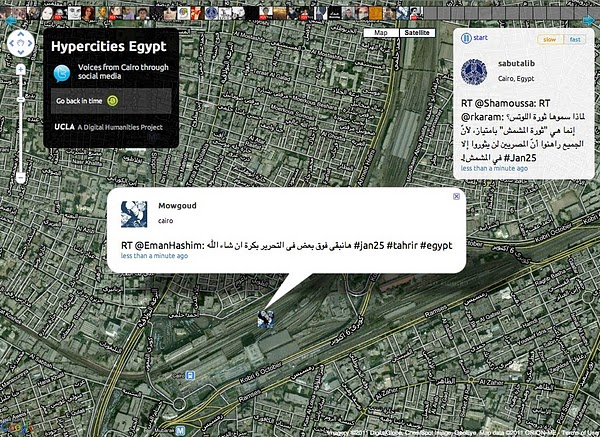
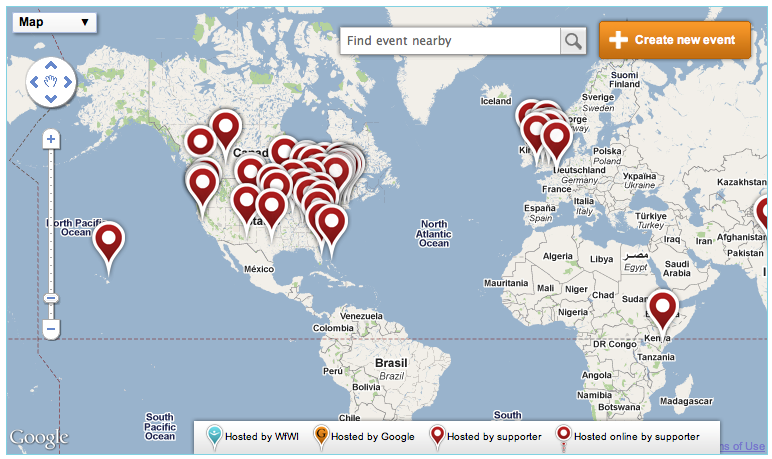
Twitter’s real-time updates have become an invaluable tool for the Egyptian protest organizers, observers and citizens looking to stay safe. Hypercities Egypt used Google Maps to display geolocated tweets as they came streaming in. Also, view another Egypt Twitter map created by MiBazaar.

GeoEye Tahrir Square Imagery

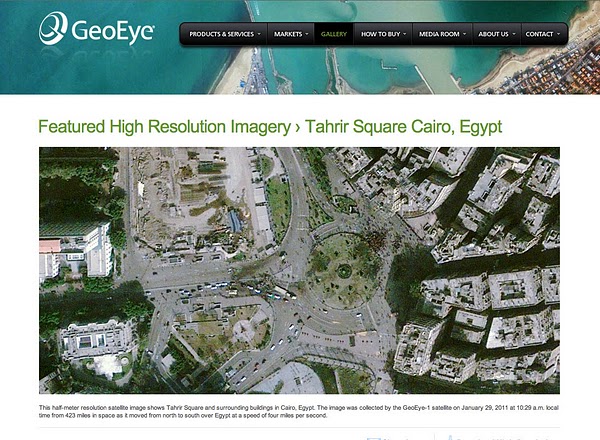
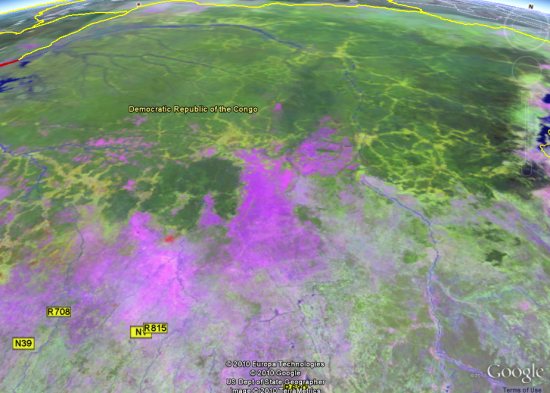
The imagery above is of Tahrir Square on January 29, 2011 at around 10:30am local time from more than 400 miles above. This imagery is exclusively viewable in Google Earth (and the Earth API) using the historical imagery tool. The imagery highlights GeoEye’s stunning ability to respond to world events and capture timely imagery.

Egypt Protests in Google My Maps by Storyful.com

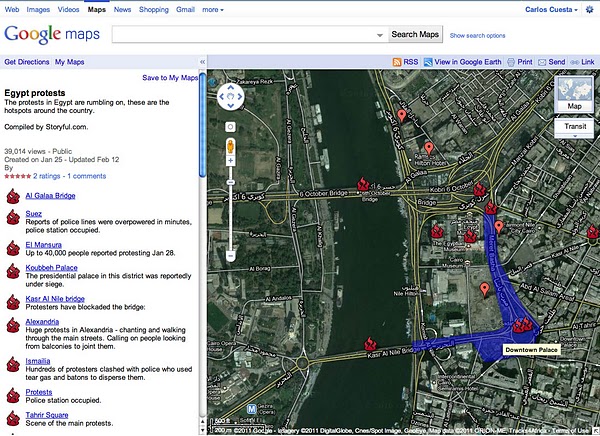
During the crisis, many Geo developers and persons without a Geo developer background collaborated on Google My Maps to chronicle the events geographically as they unfolded, such as this one by Storyful. Using the My Maps tool, anyone with access to Google Maps could create a collaborative mash-up with custom icons, colored polygons, content rich info-bubbles and many other features. Once completed, the map can be shared globally through My Maps or embedded on a website. Access can also be restricted to a select group of people if need be. Learn more at http://maps.google.com/getmaps.

———–

How you can help: During a crisis situation, up-to-date maps are often crucial for organizing humanitarian aid and effective response. In many regions, however, accurate and local map data is sparse, out of date, or not available at all. You can add your geographic knowledge to Google Maps by contributing map edits in Google Map Maker, which is currently available in select countries and territories.

Join us on the bridge for International Women’s Day 2011

I lead a global team at Google and travel extensively. When I speak about my work, the questions I get are often about the efforts we make to bring more women into engineering and how I maintain my work/life balance with two young children. These are very important questions, but I’m acutely aware that they reflect a certain amount of privilege when it comes to issues of women’s equality. Despite the incredible advances women have made in the last century, many around the world are still struggling to provide for their families and keep them safe amidst violence and instability.

For the past several years I’ve been part of a sponsorship program administered by Women for Women International, an organization dedicated to helping women survivors of war rebuild their lives. Every time I receive a letter from a woman I sponsor, each of whom is determined to improve her life despite the terrible odds she faces, I’m reminded of why it’s so important that we all—women and men alike—recognize the challenges women continue to face around the world.

That’s why I’m so excited to celebrate the centenary of International Women’s Day on March 8, 2011. This year Google is collaborating with Women for Women International on their “Join me on the Bridge” campaign. Originally conceived of by women from Rwanda and Congo as a sign of solidarity between women in two conflict-ridden countries, last year’s campaign brought together thousands of women and men at more than 100 bridge events on four continents.

This year we’re making it simple for you, your friends, your classmates and your colleagues to participate in bridge events on International Women’s Day by offering new online resources.

To attend a bridge event, check our map to see all the events that have already been planned. Or you can use our event toolkit to plan your own event on the bridge of your choice. You’ll see that there are two kinds of events—physical and online; if you’re not able to attend a bridge event in person on March 8, you can lend your support online by virtually attending an event via Street View in Google Maps.

Finally, on our International Women’s Day 2011 site, you can to donate to Women for Women International and more than 40 other incredible organizations working in the fields of women’s economic security, education, empowerment, equality, health and safety.

See you on the bridge on March 8!

Google Earth Engine, an amazing tool for scientists and researchers, released at COP 16

Yesterday at the International Climate Change Conference, Google released a mountain of data for scientists around the world to analyze and use. Known as “Google Earth Engine“, it gives researchers access to this huge pile of data, along with computing power to deal with all of it.

The data includes Landsat satellite data and “trillions of scientific measurements” covering the past 25 years.

So what can be done with all of this data? Thanks to some launch partners, there are already a handful of projects underway. For example, below is a map showing the loss of forest cover in the Congo for the past 10 years, taken from the Earth Engine Map Gallery.

congo.jpg

To go along with this, Google is also donating 10 million CPU-hours for each of the next two years, to help developing nations track the state of their forests. This is in anticipation for REDD (Reducing Emissions from Deforestation and Forest Degradation in Developing Countries), which offers financial incentives for tropical nations that protect their forests.

Do you plan to use Google Earth Engine? If not, what would you use it for if you had the chance?