London Twitter Network Map

Fabian Neuhaus author of Urban Tick here at the Centre for Advanced Spatial Analysis, University College London has kindly agreed to write a guest post on the London Twitter network, the zoomable version embedded below is particularly notable:

Following up from the New City Landscape maps, where we mapped tweet densities in urban areas around the world, we have now started to look into the socia network aspects of this data set. As a complementary graph to the map the network illustrates how the twitter users are connected through their activities and usage of the platform.
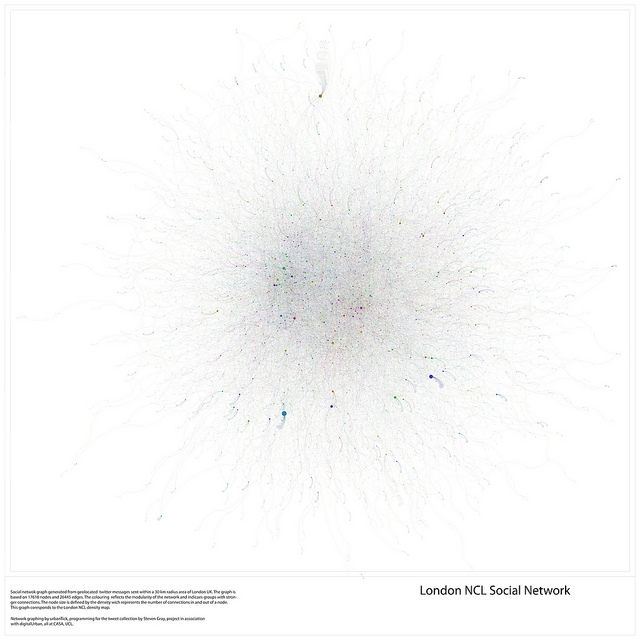
LND-NCL_NWgraph_s
Graph by urbanTick / The London NCL Social Network graph of twitter users. The dataset is defined as geolocated tweets collected over the period of one week in the urban area of London set to a 30 km radius. Click on the image for a larger version on flickr or see the interactive zoomable version HERE.

The network is built from nodes and edges, were the nodes are the twitter users active during the time period of message collection back in May 2010. The edges visualise the connections between these users. From the messages sent connections are established based on activity and interaction. In reality these are the @ messages that are directed at one or more particular user. The second indicator of a connection are the RT messages, the message that have been retweeted by followers of the creator of the initial message.
LND-NCL_NWgraph-04
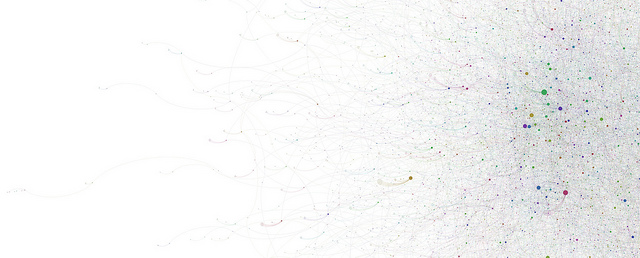
Graph by urbanTick / Zoom of the London NCL Social Network graph of twitter users. The dataset is defined as geolocated tweets collected over the period of one week in the urban area of London set to a 30 km radius. Click for a larger version on flickr.

Using these two methods the network graph is established as a directed network, meaning that the connection between the nodes has a direction since a message originates from a sender being delivered to a receiver.

The resulting network is built from a total of 17618 nodes and 26445 edges. In the case of this London twitter network not everyone is connected to everyone and about 5400 subnetworks were identified. Furthermore via the colouring the modularity of the network is visualised. Each subgroups has a unique colour shading indicating groups with tighter connections.

London NCL Social Network

Graph by urbanTick using the GMap Image Cutter / London NCL Socia Network – Use the Google Maps style zoom function in the top left corner to zoom into the map and explore it in detail. Click HERE for a full screen view.

The sizing of the nodes is derived from the number of connections this particular node has for both incoming and outgoing edges.

For the comparison of the networks we are currently working on graphing out the whole range of NCL across the world in order to establish a analysis parameter set. We’ll keep you posted about the progress here.

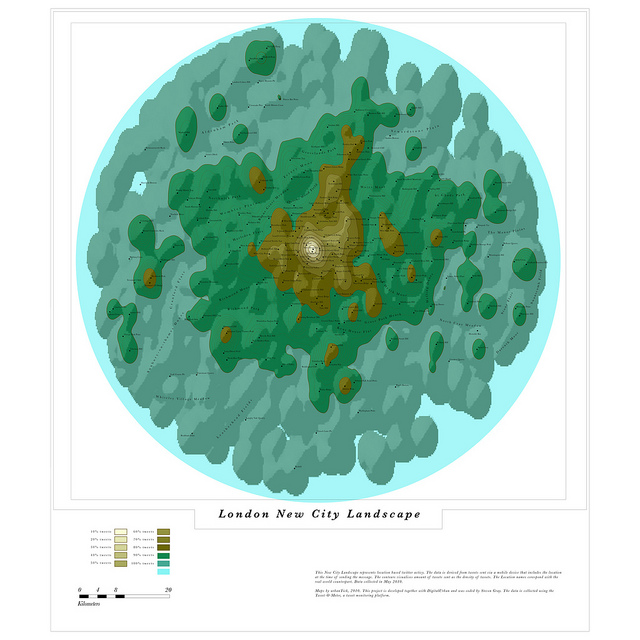
To compare it, the geolocated London New City Landscape map. It is important to keep in mind that the graphs are not spatially representative as compared to the NCL maps which are properly geolocated.
london_contourColour_2
Image by urbanTick using the GMap Image Cutter / London New City Landscape Click HERE for a full screen view.


Post by Fabian Neuhaus, Urban Tick.
The next generation of mobile maps

I’m excited to announce Google Maps 5.0 for Android, with two significant new features: 3D interaction and offline reliability.
We launched Google Maps for mobile a little more than five years ago. Since then, we’ve added dozens of features, and we’ve grown from a few thousand to more than 100 million users. Still, a couple of things have remained the same: a flat, north-up map and the need for a strong Internet connection. Today, we’re changing that for the first time.

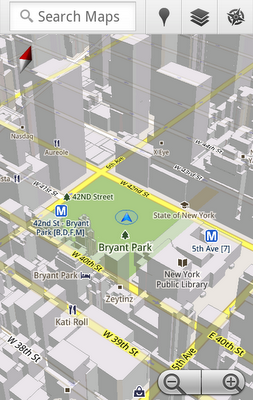
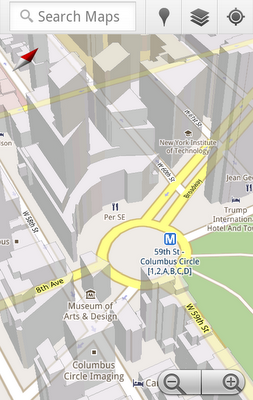
Tilt while zoomed in (left) or use compass mode (right) to orient yourself with 3D buildings.


Explore maps in 3D
Until now, Google Maps has always downloaded the map as a set of small, square images that we stitch together to form the map you see. (You’ve probably seen those gray squares getting filled in, block-by-block, as the images load over the network.) Starting today, we’ll use vector graphics to dynamically draw the map on your device as you use it, allowing you to interact with it in new ways:

  • Tilting: Drag down with two fingers to tilt the map. Tilt while zoomed in on one of the 100+ cities around the world with 3D buildings to see a skyline spring to life.
  • Rotating: Twist with two fingers to rotate the map. After tilting to see 3D buildings, rotate around them to gain a new perspective from any direction.
  • Smooth zooming: Slide two fingers together or apart, and see the map and labels continuously scale to any zoom level, stopping when your fingers stop.
  • Compass mode: Center the map on your location, and then tap the compass button in the top right corner. The map will flip into 3D mode and start rotating to match your perspective, while still keeping all the labels upright and readable.

I found 3D buildings especially useful on a recent trip to New York. From my hotel to the Google office in Chelsea and bars on the Lower East Side, this richer representation of the real world made the map much more helpful. And whenever I walked out of a building or subway station, I used compass mode to get myself quickly oriented and on my way. Check out the video below to see tilt, rotation, zoom and compass mode in action, or see more pictures.

Offline reliability
Google Maps has always been, and continues to be, a fundamentally Internet-connected experience, meaning you always get the freshest map and place data, search and voice search, live traffic conditions, satellite and Street View imagery, and much more. Still, we understand that mobile Internet connections aren’t 100% reliable. So today we’re happy to take the first steps toward greater offline reliability, so you can find your way even if you lose your connection.

In the past, you’ve probably had frustrating moments when you get stranded without a map, whether ducking into the subway, sitting at the back of a restaurant or traveling anywhere with a flaky Internet connection. But dynamically drawing maps requires 100 times less data to get maps across all zoom levels, so now we’re able to proactively cache (or store) large areas on your device based on where you use Maps the most. This way, you can rely on having fast, robust maps available to you where you’re most likely to need them.

For example, I live in San Francisco and work in Mountain View, so Maps makes sure I can always pull up detailed street maps of each city and area maps for the whole San Francisco Bay Area. When I do have an Internet connection, I still get live traffic, imagery, richer map details and all the other features I’m used to with Google Maps.

Rather than having a static set of maps when installed, Maps will automatically start caching the areas you visit the most when your device is plugged in and connected to WiFi (e.g., the nightly charge). We’re already hard at work improving the algorithms and technology behind these features, so over time you can expect to see maps work better in more offline situations.

Offline rerouting
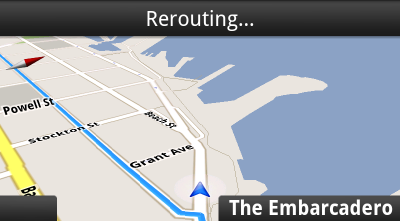
If you’re one of the more than 10 million people relying on Google Maps Navigation (Beta), our free turn-by-turn GPS navigation feature, losing your Internet connection can be particularly painful. (This happened to me on a recent ski trip to Tahoe, and I was left trying to manually find my way back to my route.) So we’re also introducing offline rerouting. You’ll still need a connection to start a route, but if you miss a turn along the way, we’ll quickly get you back on track, even if you don’t have an Internet connection. We’ll be rolling this feature out gradually over the next few weeks.

Google Maps Navigation now automatically reroutes you, even if you lose your connection.

These new features are just the first steps in maximizing dynamic map drawing technology to create a faster, more interactive experience where efficiency really matters: mobile devices. For example, we estimate that viewing maps now requires almost 70% less mobile network data overall than before. We can’t wait to take the next steps in making Google Maps faster, more reliable and even more useful no matter where you take it.

Get Google Maps for mobile 5.0 by searching for Google Maps in Android Market (or tap on this link if you’re on your phone). Android 1.6+ devices can get Maps 5.0, but 3D and offline features require Android 2.0+, and some features may not be supported for all devices or countries.

So try it out. Wander around in compass mode, explore 3D buildings—even dare to open Maps on the subway! I hope you enjoy all the new features as much as we do.

Social network phenomenon

“Social networking” phenomenon is driving astronomical growth of many online companies, from the leaders of the pack like Facebook, to numerous peddlers of “make quick money online” self-help guides. The bigger the network/ mailing list, the larger the company value and profits. But what is really behind this phenomenon? I am leaning towards a conclusion that it has nothing to do with “social” but rather with our limitation to deal with information overload

Let’s look at this objectively. The capacity for individuals to participate in various social exchange networks was available from the early days of the Internet: forums, discussion boards, chat services and the like. However, the limitation was that these were mostly thematic based networks. With rapid growth of themed content on the Internet it all became very fragmented and difficult to follow…What Facebook, Twitter and the like brought to the mix was the capacity to participate/ follow many themes from a single portal! So, rather than helping user engage in “social networks” what those companies are really doing is assisting in information exchange! As simple as that. Just think about it. A person “following” a company on Facebook or Twitter has nothing to do with “social interaction” with that company – it’s not about “belonging” or “association” / “being part of a social group”. It’s all about access to specific information of interest to that individual (humour or other forms of entertainment, news, events, specials, etc.)!

Same applies to relationships between individuals – sociologists claim normal individuals are not capable of true social relationship with more than 150 counterparts at a time. Yet social network sites are full of people with thousands of contacts… Again, it is all about information and trusted channels of access to information, not about social interaction! The fact that individuals can participate in discussions and exchange messages is a part of the deal – some take advantage of it, others do not. True, the focus on “friends” helped Facebook to grow those personal networks at a rapid rate to propel the company to number 1 network facilitator but I will argue the key driving force was “the need to know” and not “the need to belong” (opening up the network to others and not only college students was the best and most logical decision to make since it is not about who you are but rather what you need to know!).

The information overload is what in my opinion is driving the popularity of the thing labelled as “social networking”. People want to know what is happening in their immediate environment, places of interest, topics of interest AND people they associate with (friends, colleagues, celebrities, etc.). At the same time people want to participate in some of those forums personally. Not enough time to read/see/do everything so the only way to keep up is to revert to “skimming over main headings” and to “following” limited number of information themes (on demand, user initiated).

What is helping in managing communication complexity associated with information overload is wide acceptance of abbreviated message format. It could be argued that the format was first introduced by Google Search – we all are so used to it: title and a short description of content. Just compare the main content pages of Facebook, Twitter, LinkedIn or Google Search … they all follow the same “short message format”!

I believe “social network” is a bit of misnomer as it implies only personal interactions of a casual nature. It is more than that! And the implications of this view on the state of affairs are far reaching. Let me just share a few observations. Firstly, for publishers and participants in networked information exchange it highlights the importance of catchy titling with informative but short secondary tag line to draw attention of “skimmers” (the principle is nothing new and has been applied in print advertising for ages…). Short form content sharing and aggregation will only grow in popularity. This is a great opportunity for content aggregators and gadget makers and another warning for those considering locking their content exclusively behind pay walls (although can also be seen as a great opportunity if enough of short content is left in the public arena!).

Secondly, it implies that the importance of Google and other search engines (and hence SEO for marketing) will be diminishing as “search” is starting to loose ground to “personal recommendations”. A new information referral model is emerging on the Internet where “opinion leaders” (ie. those with large personal networks) are starting to play more significant role in directing online traffic. The bad news for online advertisers and marketers is that it is a very fragmented channel of communication. It also means that the concentration of online advertising power will be shifting to network facilitators, such as Facebook, and away from search focused sites. Some food for thought…