Render with Mapnik

I explained a little about the process by which you can overlay raster data on Bing Maps, by geo-referencing the source data (if necessary), projecting into the appropriate spherical Mercator projection, then cutting the resulting image into 256px x 256px tiles named according to the quadkey tile numbering system.

The application I used in the last example to do this was Microsoft Mapcruncher. Mapcruncher has got a lot of benefits:

  • It’s free
  • It’s a windows application with no special dependencies and easy to install
  • It’s got a nice GUI that’s very easy to use
  • It will perform geo-referencing/warping/tile-cutting for you as part of a single process

Mapcruncher is great if you have a relatively small raster image that you want to integrate into Bing Maps / Google Maps as part of a one-off process. However, there are many occasions when you might need a little more than that. As part of a current project, for example, I need to create a tileset that covers an area of approximately 60km x 50km (not that small), based on data held in SQL Server 2008 (not raster), that will be updated approximately every month (not one-off).

So I set out to evaluate alternatives, and the first I considered was mapnik.

Installing Mapnik

Mapnik is an open-source mapping toolkit. It’s what openstreetmap uses to render the tiles used in their base map imagery. They’ve got over 220Gb of XML data in the planet.osm file, covering the whole world, with thousands of updates every day, so if mapnik can render that I’m pretty certain it should be able to cope with my modest requirements.

Mapnik tiles in Open Street Map

Installing and configuring mapnik, unfortunately, turned out to be quite a challenge, and has taken me a significant amount of time to get a working installation. In fact, had I realised quite how many steps would be involved, I’d probably have taken more care to document them carefully. As it is, I’m going to try to note down in this post what I did while they’re still relatively fresh in my mind.

What about using pre-compiled Windows binaries?

Mapnik, like many open source applications, is primarily targeted at a UNIX stack. That means that a large part of the documentation will refer to commands like sudo apt-get, which will look fairly alien to many Windows users. There’s also a lot of dependencies on other packages – python, libboost, libpng, etc. which you may not be familiar with.

Now, fortunately, some kind people have taken the time to prepare pre-compiled Windows binaries of these various tools, and even packaged them together in convenient download format.

For example, the OSGeo4W package contains windows binary executables for Mapnik, along with the GDAL library (used for importing, converting of various spatial data formats), QGIS (open source desktop GIS application), and many other useful open source spatial goodies. The problem is that, with trying to keep track of all those separate dependencies, the package itself can become out-of-date quite quickly. The latest build of OSGeo4W, for example, is still based on python 2.5.2-1. The current build of the 2.x branch of python is 2.7.1, and even that represents the end-of-life release for the 2.x branch. The latest version of python is actually 3.2. I didn’t really want to start a project on software that had already been deprecated.

Likewise, the excellent FWTools project, which also bundles together many of the same packages as OSGeo4W still comes bundled with Python 2.3.4 and version 1.7 of the GDAL library. Crucially, for me, GDAL introduced support for SQL Server as a spatial data source only in version 1.8, so using FWTools wasn’t an option either.

What’s more, Mapnik itself seems to have forked into two versions – the current stable release being 0.7.1, but with many comments being made about breaking changes in the new 2.x development version. The only precompiled windows binaries I could find were of the 0.7 version and, again, I didn’t want to invest a lot of time setting up a project based on software that was about to go out of date.

So, precompiled binaries was, at this stage, a no-go.

Build-It-Yourself

I decided I was going to have to build my own installation, and here was my wish list:

  • Python 3.2
  • GDAL 1.8
  • Mapnik 2.x

Python was (thankfully) easy to install – there’s an installer package available from http://python.org/ftp/python/3.2/python-3.2.msi

GDAL was also not too bad – there are x86 and x64 packages (bundled with mapserver) that you can download from http://www.gisinternals.com/sdk/

Now onto Mapnik. And it is here, with retrospect, that I wish I’d stated taking notes. You can download the source for mapnik from here. However, before compiling mapnik itself, you need to download and/or compile its required dependencies. These are: proj4, boost, zlib, freetype, icu, libxml2, libpng, libjpeg, and libtiff.

Now, you could download the source for each of these and build them separately but fortunately, once again, some kind soul has done much of this work for us. If you go to the gnuwin32 project on sourceforge, you’ll find links to download most of these libraries. For those packages not included in gbuwin32, ICU is available from here, and you can get the latest zlib from here.

Once you’ve got all the dependencies sorted out, it’s onto the configuration changes. If you follow the article at http://trac.mapnik.org/wiki/Python3k you’ll see a number of steps required to rebuild the python bindings with Mapnik to target Python 3.x. After some fiddling about with these and a bit of guesswork, I managed eventually to get everything built.

Testing it Out

Mapnik comes with a test script so, gingerly, I tried running it. Lots of errors – couldn’t find xxx etc. I realised this was because I hadn’t set the environment variables and paths correctly so, after sorting this out, I had another go. This time looked a lot more promising:

image

And, lo and behold, here was the (beautiful) example image generated:

demo_high

Over-confident of my new found ability, I then tried altering the example rundemo.py script to point at a SQL Server datasource. Mapnik supports OGR datasources, so I first created a virtual layer that connected to my SQL Server. For the purposes of testing, I decided to select a set of data from the OS VectorMap District settlement area data (note that I’m not sure if OGR can deal with SQL Server’s native binary geography/geometry format, so I use STAsText() to get the WKT representation and then specify WKT encoding in the GeometryField):

[php]

MSSQL:server=.SQLEXPRESS;database=OSVectorMap;trusted_connection=yes
SELECT geom27700.STAsText() AS geomWKT FROM TG11_Settlement_Area</pre>
[/php]

Testing the virtual layer with ogrinfo seemed to suggest that everything was working ok:

image

So then I modifed the python script to add the new layer. Note that OS Vectormap data is defined using the OSGB British National Grid coordinate system (EPSG:27700), and mapnik expects the parameters for the srs property to use PROJ4 syntax, which you can get from http://spatialreference.org/ref/epsg/27700/proj4/:

[php]vectormap_lyr = mapnik.Layer(‘OS Vectormap’)
vectormap_lyr.srs = "+proj=tmerc +lat_0=49 +lon_0=-2 +k=0.9996012717 +x_0=400000 +y_0=-100000 +ellps=airy +datum=OSGB36 +units=m +no_defs"

vectormap_lyr.datasource = mapnik.Ogr(file=’MSSQL.ovf’,layer="AASQLlayer")</pre>
[/php]

Unfortunately, here I hit another problem:

image

And it seems here my luck has run out, because I simply can’t work out how to get round this one. The error message is simply “Failed to open datasource”, yet ogrinfo confirms that the datasource is fine, and other GDAL/OGR components can read from it, so I don’t know if it’s because I built mapnik wrong or forgot to change/include a particular setting.

I did just notice that there’s a Google Summer of Code Project to improve Mapnik installation on Windows, and I’m really hoping it’s successful because the results generated by Mapnik are beautiful.

As a workaround, I actually used OGR2OGR to export my data from SQL Server into a shapefile called MSSQL_export.shp, and then used that as a datasource in Mapnik by changing the python datasource to:

[php]
<pre>vectormap_lyr.datasource = mapnik.Shapefile(file=’MSSQL_export’)</pre>
[/php]

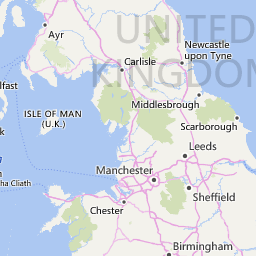
Finally, after a bit of XML styling, I was able to get the following image (click for full size):

image

I’m actually really pleased with the image quality, but until I can get Mapnik to retrieve data directly from SQL Server there’s not much point proceeding with the tilecutting process – I can’t really justify an additional step of exporting from SQL Server to shapefile just to get Mapnik to load it.

If anyone has had any success of getting Mapnik and SQL Server to play nicely together, please let me know!

Bing Maps v.7 control on an Address Rather than a known Latitude/Longitude

This was a question that came up at the cloudhack event last weekend – when you create a new instance of the Bing Maps AJAX control, you specify the centrepoint of the map in latitude and longitude coordinates, using the center property in the viewOptions passed to the constructor. For example:

[php]
var map = new Microsoft.Maps.Map( document.getElementById("mapDiv"),
{ credentials: ENTERYOURBINGMAPSKEY,
center: new Microsoft.Maps.Location(54, -4),
mapTypeId: Microsoft.Maps.MapTypeId.aerial,
zoom: 12
});

[/php]

(You can view more information on the viewOptions parameters here: http://msdn.microsoft.com/en-us/library/gg427628.aspx )


However, what if you want to create a map centred on an address instead of a latitude/longitude coordinate? This seems like a fairly simple, common request, so I was a bit surprised to find that none of the Microsoft method reference guides nor any of the “interactive SDK” sites provide an example showing how to do this.

Fortunately, it’s not too tricky to do so, for the benefit of everyone other than those teams at the cloudhack event who asked me, I thought I’d write it up here ;)

First, you need to geocode the address into latitude and longitude coordinates (using theREST Locations API is the easiest way to do so direct from javascript). Then, in the jsonp callback function that is executed after the geocode service returns its results, create and centre the map on the returned coordinates. Here’s an example (note that you will need to replace ENTERYOURBINGMAPSKEY here with some valid credentials, or else the call to the REST service will fail and the map will not be created):

[php]
<!DOCTYPE HTML PUBLIC "-//W3C//DTD XHTML 1.0 Transitional//EN" "http://www.w3.org/TR/xhtml1/DTD/xhtml1-transitional.dtd">
<html xmlns="http://www.w3.org/1999/xhtml">
<head>
<title></title>
<meta http-equiv="Content-Type" content="text/html; charset=utf-8" />
<script type="text/javascript" src="http://ecn.dev.virtualearth.net/mapcontrol/mapcontrol.ashx?v=7.0"></script>
<script type="text/javascript">
var map = null;
var credentials = "ENTERYOURBINGMAPSKEY";

function GetMap() {

// Define the address on which to centre the map
var addressLine = "54 Chiswell Street"; // Street Address
var locality = "London"; // City or town name
var adminDistrict = ""; // County
var country = "UK"; // Country, obviously
var postalCode = "" //Postcode

// Construct a request to the REST geocode service
var geocodeRequest = "http://dev.virtualearth.net/REST/v1/Locations"
+ "?countryRegion=" + country
+ "&addressLine=" + addressLine
+ "&locality=" + locality
+ "&adminDistrict=" + adminDistrict
+ "&postalCode=" + postalCode
+ "&key=" + credentials
+ "&jsonp=GeocodeCallback"; // This function will be called after the geocode service returns its results

// Call the service
CallRestService(geocodeRequest);
}

function GeocodeCallback(result) {
// Check that we have a valid response
if (result && result.resourceSets && result.resourceSets.length > 0 && result.resourceSets[0].resources && result.resourceSets[0].resources.length > 0) {

// Create a Location based on the geocoded coordinates
var coords = result.resourceSets[0].resources[0].point.coordinates;
centerPoint = new Microsoft.Maps.Location(coords[0], coords[1]);

// Create a map centred on the location
map = new Microsoft.Maps.Map(document.getElementById("mapDiv"),
{ credentials: credentials,
center: centerPoint,
mapTypeId: Microsoft.Maps.MapTypeId.aerial,
zoom: 18
});

// Add a pushpin as well
var pushpin = new Microsoft.Maps.Pushpin(map.getCenter());
map.entities.push(pushpin);
}
}

// This is a generic function to call a REST service and insert the JSON
// results into the head of the document
function CallRestService(request) {
var script = document.createElement("script");
script.setAttribute("type", "text/javascript");
script.setAttribute("src", request);
var dochead = document.getElementsByTagName("head").item(0);
dochead.appendChild(script);
}
</script>
</head>
<body onload="GetMap();">
<div id=’mapDiv’ style="position: relative; width: 400px; height: 600px;">
</div>
</body>
</html>

[/php]

Here’s the resulting map:

Tile cutting Raster Imagery and geo referencing

Just as there are many different formats in which vector spatial data may be represented: Well-Known Text (WKT), Well-Known Binary (WKB), Geography Markup Language (GML), and Keyhole Markup Lanuage (KML), to name but a few – so too are there many different formats of raster spatial data.  In fact, almost any image format can be used to encode raster spatial data – since each pixel in an image naturally corresponds to an X,Y location in a raster grid. Any regular BMP, GIF, PNG, JPG, or TIFF image file can therefore be used to store spatial data, so long as the real-world coordinates corresponding to the pixels in each corner of the image are known (and thus the coordinates of each other pixel in the image can be determined). The process of assigning coordinates from a spatial reference system to a raster image is known as geo-referencing.

Some dedicated spatial raster formats, such as GeoTIFF, encode coordinate metadata along with the image data in a single file. However, the raster images used by Open Street Maps, Bing Maps, and Google Maps don’t use GeoTIFFs – they are formed from a series of 256px x 256px tiles saved as regular PNG and JPG images. The metadata describing the geographic extent of each tile is encoded entirely in the filename, which, in Bing Maps, uses the quadkey numbering system as described here.


For example, the following tile shows the Bing Maps road map style tile for quadkey 031311, retrieved from http://ecn.t1.tiles.virtualearth.net/tiles/r031311.png?g=685&mkt=en-us

Knowing nothing but the quadkey number, 031311, and the formulas in the MSDN article linked above, I can calculate that the exact geographic extent of features shown on this tile lie from longitude of –5.625 to 0, and latitude between 52.4827802220782 and 55.7765730186677. Like all Bing Maps tiles, they are projected using the Spherical Mercator projection.

Here’s another tile – this time 120200223:

Once again, I can immediately determine from the quadkey that the extent of this tile has longitude ranging from 0.703125 to 1.40625 and latitude from 52.4827802220782 to 52.9089020477703.

The quadkey system is quite beautiful in its simplicity and efficiency. There are, of course, some limitations with this sort of tiling system – all raster data must be represented using the same projection, and every tile must be regularly-sized, for example, but these limitations are offset by the ease with which it’s possible to place any tile at any zoom level at the correct position on the map with minimum amount of coding.

Preparing Custom Tiles

To get your own raster data into Bing Maps (such as a digitized map or floor plan), you need to prepare a series of individual quadkey tile images following the structure outlined above. Applications such as Safe FME and Microsoft MapCruncher provide the ability to prepare raster images for use as background tile layers in Bing Maps (or Google Maps), or you can write your own script to do so. The process is generally known as “tile-cutting”, and the steps are described below:

1.) First, start out with a source image. Here’s John Snow’s famous map of the Cholera outbreak that occurred in Broad Street in London, 1854:

2.) Georeference the image, by assigning coordinates to corresponding pixel positions in the image. If the image is not already in the correct projection, it might need to be warped to bring features into line with the Mercator projection as used by Bing Maps. The image below shows the interface provided by Mapcruncher for placing reference points in the source image (left hand pane) and Bing Maps (right hand pane):

3.) The geo-referenced, transformed image must then be cut into a series of 256px x 256px tiles at different levels of magnification, numbered according to quadkey. For example, the tile below shows a single tile from zoom level 16 of the above image (quadkey 0313131311122330):

4.) Finally, create a tilelayer that references the set of quadkey tile images. Assuming that the tiles are all saved in the same directory, this is as simple as adding the following lines of javascript. the Bing Maps v7 control will expand the {quadkey} placeholder to the appropriate quadkey filename for each tile request:

The result

Once the tilelayer is added to the map, whenever a part of that tilelayer comes into view Bing Maps will automatically request and stitch together the appropriate tile images and overlay them at the appropriate position on the map.

The screenshot below shows the result of overlaying Jon Snow’s Cholera map onto a modern day map of London using Bing Maps’ default road map style using the steps described above. Notice how well the roads that cross the edges of the tile layer line up – John Snow was not only the father of epidemiology, but also a highly talented cartographer: