As Google has continually improved the quality of their imagery across the globe, one area always seemed to stay low-res — Antarctica. Thanks to the help of the Polar Geospatial Center (PCG), that’s beginning to change.
A great example of that is the Mackay Glacier Tongue, located in Granite Harbor, seen here:
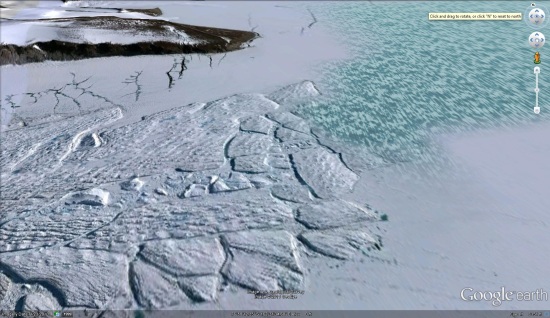
You can see it for yourself, as shown in the article, using this KML file .
.
So far, the PGC has helped Google update nearly 1,000,000 square kilometers, with another 275,000 square kilometers added every three months. While it will take a while to get the entire continent updated (more than 14,000,000 sq km), they’re certainly making great progress.
Along with updating the quality of the imagery, they’re also working to improve the accuracy of the location of the imagery. The PGC’s Paul Morin will be heading down to the Antarctic Peninsula soon to help improve the imagery from being off by as much as 30 meters to being accurate within a single meter.
The full article at The Antarctic Sun is quite interesting and well worth your time to read. We all enjoy the constantly improving imagery quality in Google Earth, and the PGC is just one of many companies working with Google to help move things forward.
(via @OgleEarth)