Geographic data of Google Search with the WebGL Globe

Today we’re sharing a new Chrome Experiment called the WebGL Globe. It’s a simple, open visualization platform for geographic data that runs in WebGL-enabled browsers like Google Chrome. The globe below shows world population, and we’ve created another globe showing Google search traffic.

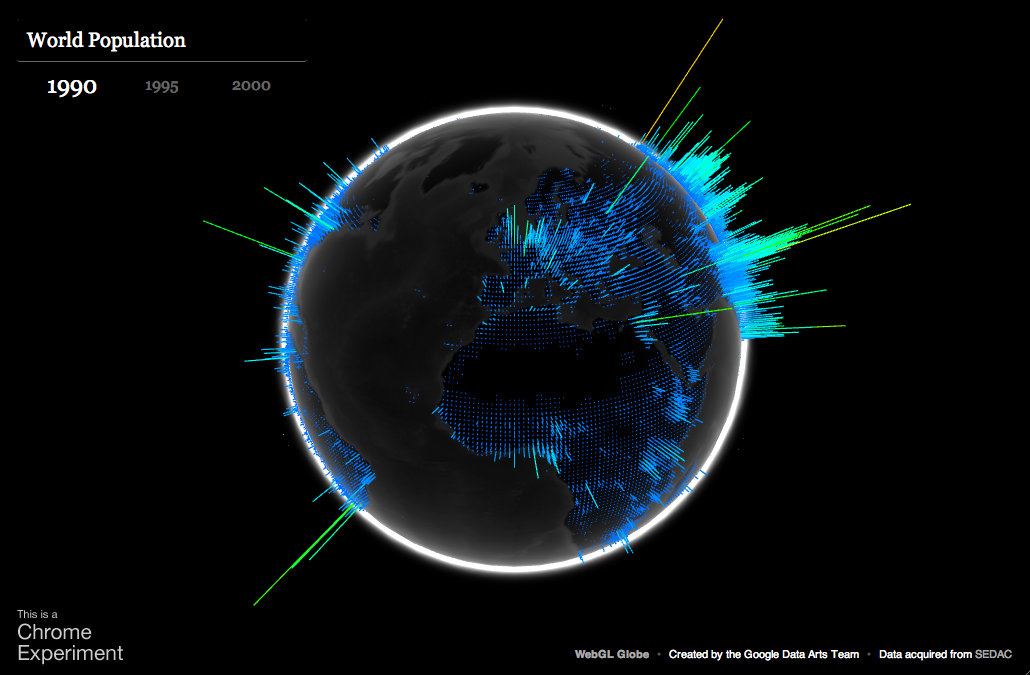
The primary challenge of this project was figuring out how to draw several thousand 3D data spikes as quickly and smoothly as possible. To do this, we turned to Three.js, a JavaScript library for building lightweight 3D graphics. For each data point, we generate a cube with five faces – the bottom face, which touches the globe, is removed to improve performance. We then stretch the cube relative to the data value and position it based on latitude and longitude. Finally, we merge all of the cubes into a single geometry to make it more efficient to draw.

The second challenge of the project was animating the globe – we wanted it to be fun for the user to manipulate. Thanks to WebGL, we’re able to display thousands of moving points at high frame rates by using the user’s graphics processing unit (GPU) for 3D computations. Each state of the globe has its own geometry and we morph between them with a vertex shader, saving precious CPU resources. Additionally, to make the globe look nice, we took advantage of the possibilities of GLSL and created two fragment shaders, one to simulate the atmosphere and another to simulate frontal illumination of the planet.

Now that we’ve released the globe, we’re hoping that developers like you will create your own. What data will you show on it? If you’re feeling inclined, you can learn more about the data format (represented in JSON) and get the code here. If you create your own globe, please also consider sharing a link with us — at some point in the future, we hope to post a list of interesting globes that have been submitted.

Bing Maps – Piracy Watch


Piracy Watch uses Bing Maps to help visualise piracy incidents around the globe from 1978 to present, displaying the data in both a map and timeline. The visualization also includes a heat map to give an immediate understanding of what parts of the world have been most impacted.

It is possible to click on any of the map markers to get further details of an incident. You can also click on the incidents displayed in the timeline to load the details and to see it highlighted on the map.

Piracy Watch

Supermodeler Story: Zeljko Zdravkovic

Here’s a testimonial from Zeljko Zdravkovic (a.k.a Zex), who told us about his experience geo-modeling his hometown of Belgrade, Serbia.

I started modeling Belgrade because I wanted to create a 3D identity for my city. I first learned that it was possible to add a 3D building to Google Earth several years ago. I was very surprised and curious about this. I had also noticed a number of untextured models in Belgrade, and decided that I wanted to change that.

As is often the case when learning something new, I experienced many false starts. I didn’t know how to use SketchUp, or, publish a model to Google Earth. I tried and tried, in failure. It wasn’t until I noticed a little checkbox labeled “Google Earth Ready” that I realized why my models where not appearing! I laugh about it now, but it was very frustrating then!

I started to make 3D models in the summer of 2009. Today you can see over 500 models that I’ve made. When combined with the work of other geo-modelers, there are over 800 models in Belgrade, and almost 1200 models in all of Serbia (including Belgrade).

With the exception of some buildings and monuments, I’ve finishing nearly 90% of the city area. I’m hoping to complete the entire city by the end of 2011 or beginning of 2012.

Unfortunately, Belgrade area is not available in Building Maker today. If it were, it would certainly have been far faster and easier. But when I finish the entire city, Belgrade is going to be one of the most quality-built 3D cities in Google Earth, and that’s something that I take a lot of pride in—for me, model quality is number one!

Црква Светог Марка (St. Mark’s Church)

Google Earth is an excellent opportunity to promote your city to other people all over the globe. 3D models can benefit a city a lot. People all over the planet can see, learn from and enjoy the architecture of every building we make.

City TV Studio B now uses 3D “New Belgrade” area in Google Earth for traffic service information on their web site. They use a 3D map in their television broadcast. It’s such a fantastic feeling when you see your 3D models on TV, or used by others for very useful purposes.

It is so amazing how Google Earth has enabled the world to become so personal to us. Now anyone can visit every corner of the globe. It’s really amazing to me!