Google Maps Mashups 2

DHO Discovery Interface


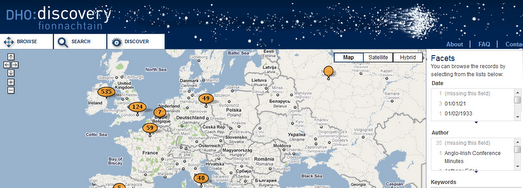
Ireland’s Digital Humanities Project is using Google Maps and the Simile Time-Line as a way to browse Irish digital collections and resources.

You can select to view a collection from the drop-down menu. Once you have selected a collection you can choose to browse the collection in a Google Maps view or on a time-line.

The map view obviously depends on whether location data has been added to individual collections.

Cairo Street Art


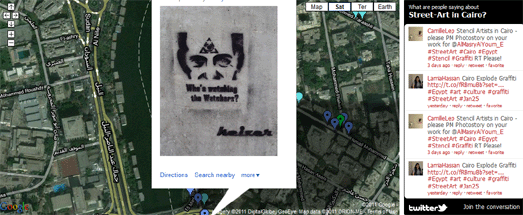
Cairo Street Art has created a Google Map that allows anyone to post photos of graffiti found in and around the Egyptian capital.

The map is actually just an embedded Google My Map. It is a nice example of how you can create a cloud based map without any programming knowledge using a collaborative Google My Map and simply embedding the map in your website.

Brown University – Campus Map


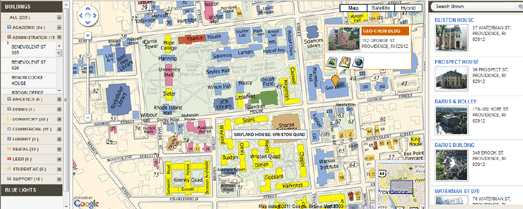
Brown University are using Google Maps to help students and visitors find buildings, parking lots and other facilities on their campus.

The Google Map uses a map overlay of the campus, which shows the names of the college buildings and is color-coded for ease of use. If you click on a building you can view a thumbnail photo and click on links to a video, a floor-plan of the building and its web page.

The Brown University Campus Map was developed by Fortune Ganesh.

Laid Off Tweets Map


There is no Friday Fun this week. Instead we have Friday Glum.

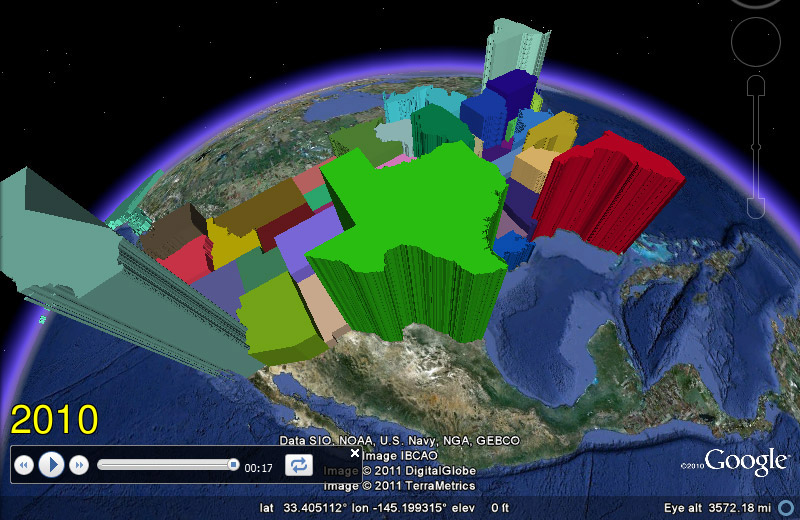
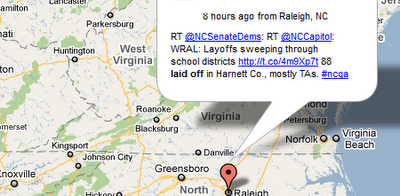
Mizabaar has created an animated Google Map that shows the latest geo-tagged tweets that mention ‘laid off’. You can select to view Tweets on the map from different regions of the United States.

This is just the latest of a series of Twitter maps from Mibazaar. If you want to create your own Twitter Map showing your own Tweets then try Mibazaar’s Twitter Status Map. This map takes your latest Twitter status update, along with your profile location, and displays it on a Google Map.

Hurtigruten: Minute by Minute


This is incredible and pretty mesmerising!

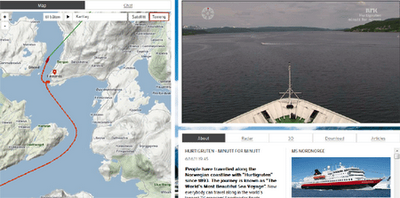
Norwegian Public Service broadcaster NRK are live broadcasting the voyage of the cruise liner Hurtigruten around the Norway coastline for 134 hours. As well as amazing live footage you can follow the position of the cruise liner on a real-time Google Map.

No money seems to have been spared for this live broadcast from the Hurtigruten. There seems to be a large number of cameras being used with some excellent editing between the various live views. There is also a pretty cool soundtrack, with the occasional addition of live commentary.

The event is obviously a big thing in Norway. Whilst I’ve been watching the voyage this morning nearly every house that has been passed has had the owners out front waving flags at the passing ship.

What makes this event unmissable however is the incredible Norwegian scenery which should be viewable for nearly the whole 134 hours, due to the broadcast being timed to coincide with the summer solstice and the Midnight Sun.

The map itself is also incredible. You can add layers of photos and videos of the cruise from a drop down menu. You can also click on the small circles on the ship’s track to change from the live broadcast to watch a replay of the footage from the selected location.

There may well be no more posts on Google Maps Mania today … as I don’t think I’ll be able to tear myself away from watching this.

Stories of Jewish Chicago


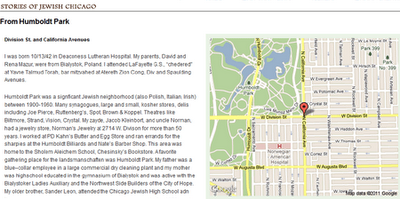
The Spertus Institute of Jewish Studies is holding an eight-part exhibit that explores the Chicago Jewish experience. As part of the exhibit the Institute is creating the Greater Chicago Jewish Memory Map.

Visitors are being asked to contribute their own personal stories of Chicago Jewish life to a Google Map of the Chicago area. You can read the submitted stories on the Stories of Jewish Chicago page. Each of the stories is accompanied by a Google Map showing the location talked about by the visitor.

Eventually all the stories will also be added to the Greater Chicago Jewish Memory Map.

High Performance KML for Maps and Earth


The Keyhole Markup Language (KML) is an open standard for geographic data presentation. There are over one billion KML files on the web, and yet the vast majority of these files are points on a map.

In High Performance KML for Maps and Earth, Sean Askay and I covered advanced techniques for using KML in Google Earth and the Earth API, as well as introduced other Google platforms that support KML. Our hope is that developers will discover the power of using KML on Google’s platform.

Some of the topics we discussed during our talk:

An Introduction to KML

A quick history and some facts and figures about KML.

Advanced data visualization techniques

We demonstrated two new animation techniques using under-utilized KML tags that make for powerful data visualizations.

First we showed a time-animated thematic map of U.S. Census data using the and tags to animate the data using a KML Tour. See this post on unchartable.com more information.

We also demonstrated also a proof of concept for pushing near real-time GPS data updates to Google Earth via a that uses and tags to inject new location data into a pre-existing GPS track .

You can download this KML file to see these two techniques in action and the other KMLs demonstrated during the talk.

Developer environment

People often ask us about a developer environment for creating KML, so we covered various options. We looked at editors, validators, and libraries, including the open source library PyKML.

KML on other platforms

We showed how to use KML in the Google Maps API and Google Fusion Tables.

So check out the slides and the video and start bringing the power of KML to your presentations.


Creating Dynamic Animated Tile Layers in Bing Maps 4


If you’ve been following this series of blog posts, you’ll know that I’ve been investigating methods to create an animated background tile layer to display weather maps using the Bing Maps v7 AJAX control.

For this final post, I’m going to wrap everything I’ve done so far into a reusable module.

Bing Maps Custom Modules and the “Ninja” update

The most recent update to the Bing Maps AJAX control, introduced in early May 2011, became slightly notorious as the “ninja” update. The reason being that, silent but deadly, the unannounced update accidentally broke many websites with no warning. Unfortunately, these breaking changes rather eclipsed some of the other nice new features introduced in the update – one of which was the introduction of a common framework through which Bing Maps could be extended by creating custom modules.

Now that the bugs introduced in the latest update have mostly been ironed out, I thought it time to investigate the new module functionality. It’s pretty easy to move your custom code into a module – the main requirement is that, at the end of your function, you place a call to the Microsoft.Maps.moduleLoaded() method. This lets Bing Maps know that your module had been loaded and ready to use.

So, I added the moduleLoaded() call, rolled my animatedTileLayer function into a file and uploaded it to http://www.a3uk.com/bm_modules/animatedtilelayer.js. Note that custom modules registered via the Bing Maps registerModule() method must be placed on a publicly-accessible website – you can’t register a custom module on a local URL. So, when you’re developing a module locally, I recommend that you get it working properly first using a regular embedded script, and then wrap it in a module at the last minute.

To use my new module, I registered and loaded it as follows:

// Register and load the animation module
Microsoft.Maps.registerModule('animatedTileLayerModule', 'http://www.a3uk.com/bm_modules/animatedtilelayer.js');
Microsoft.Maps.loadModule("animatedTileLayerModule", { callback: animationModuleLoaded });

The animationModuleLoaded callback would be fired after the module had loaded, and was responsible for creating a new instance of the animatedTileLayer class and adding it to the map, as follows:

function animationModuleLoaded() {

// Define the array of frame URLs. The URL for the tiles of each frame are
// stored in subdirectories corresponding to each timestamp, named by quadkey
var frames = [
  'http://www.a3uk.com/demos/aniamtedtilelayer/tiles/201105271015/{quadkey}.png',
  'http://www.a3uk.com/demos/aniamtedtilelayer/tiles/201105271030/{quadkey}.png',
  'http://www.a3uk.com/demos/aniamtedtilelayer/tiles/201105271045/{quadkey}.png',
  ...
];

// Create a new instance of the AnimatedTileLayer class
animatedTileLayer = new AnimatedTileLayer(
  map,     // Map instance to which tilelayer should be added
  frames,  // Array of frames of the animation
  {
     framerate: 1000,        // Delay between frame changes (ms)
     loopbehaviour: 'loop',  // Behaviour when last frame is met
     opacity: 1,             // Opacity of tile layer
     mode: 'dangerous',      // Method to use when switching layers
     frameChangeCallback: updateFrameCounter     // Callback on every frame change
   }
);

// Add the tilelayer to the map
map.entities.push(animatedTileLayer);
}

(The options passed to the AnimatedTileLayer constructor are explained in my previous posts). I also added a couple of basic HTML buttons to the page that would control starting, stopping, and resetting the animation, and a text input box that would display the timestamp of the currently displayed frame:

Animation Controls
 

The current frame counter would be updated by the function specified in the frameChangeCallback:

// Callback gets called every time frame changes
function updateFrameCounter(n) {

  // Display the frame counter
  document.getElementById('frameIndex').value = n;

  // Show the timestamp corresponding to this frame
  var t = String(timeStamps[n]);
  document.getElementById('frameTimeStamp').value = t.substr(0, 4) + '-' + t.substr(4, 2) + '-' + t.substr(6, 2) + ' ' + t.substr(8, 2) + ':' + t.substr(10,2);
}

Put it all together and what have you got?

So that’s it – my animatedtilelayer class wrapped into a custom module, registered and loaded from a page that creates a new animated tile layer and calls into a couple of the methods provided by the class.

You can play with (version 1.0) of the final product at http://www.a3uk.com/demos/animatedtilelayer/:

image

To Do:

There’s still a few bugs that I’m aware of that, at some point, I might try to fix:

  • Memory usage (especially in Firefox) seems to be an issue, and grows substantially if the animation is left running for a while – I’m not sure memory from the old tile layers is properly released following entitycollection.clear(), but I haven’t investigated this fully yet. (This problem is also reported by another user here). IE9 and Chrome appear to fare much better.
  • The tile layer vanishes while the map is scrolled (but then reappears when the map has finished scrolling) – this doesn’t seem to be unique to my animated tile layer, but is a behaviour of the way Bing Maps handles custom tile layers in general, so I’m not sure there is anything I can do about it.
  • By necessity of my attempt to pre-load the next tilelayer before displaying it on the map (to enable smoother transitions between frames), there is an initial delay after clicking “Play” before the first frame change. Again, I think this might end up being marked as “by design”!
  • I’m sure there’s more – I haven’t exactly comprehensively QA’d this module, but you’re free to make use of it as you see fit.