Google maps: New Street View imagery of historic sites in Italy and France

We’ve been busy pedaling the Street View trike around the nooks and crannies of storied sites in Europe, including palaces, monuments and castles, so you can explore them in Google Maps with Street View.

Starting today, you can view some of the most historic and architecturally significant landmarks in Italy and France, including UNESCO sites in Rome, the center of Florence and stunning chateaux in the French countryside.

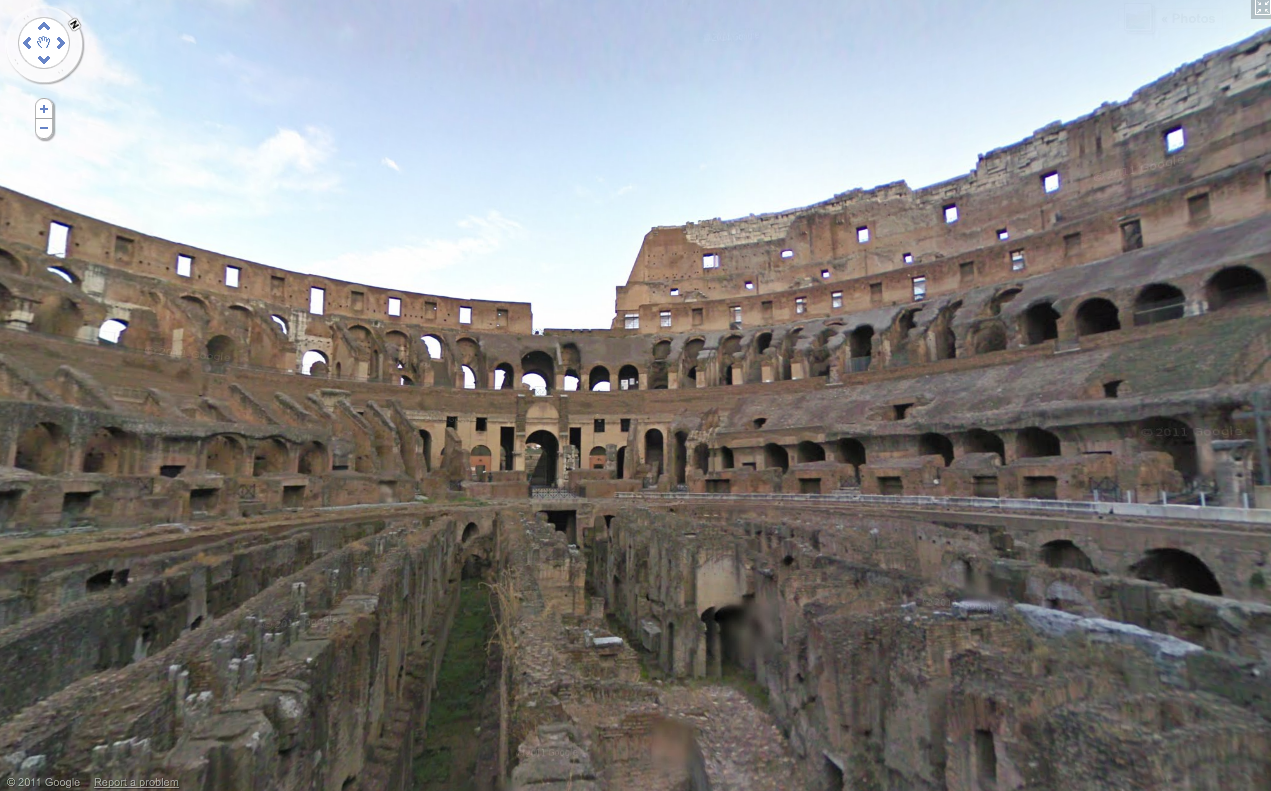
In addition to seeing the exterior of archaeological sites like the Imperial Forum and the Colosseum in Rome, you can now explore inside the Colosseum and imagine yourself viewing naumachiae—simulated sea battles for which the Colosseum was filled with water—or speaking with statesmen inside the Imperial Forum.

Inside the Colosseum, Rome

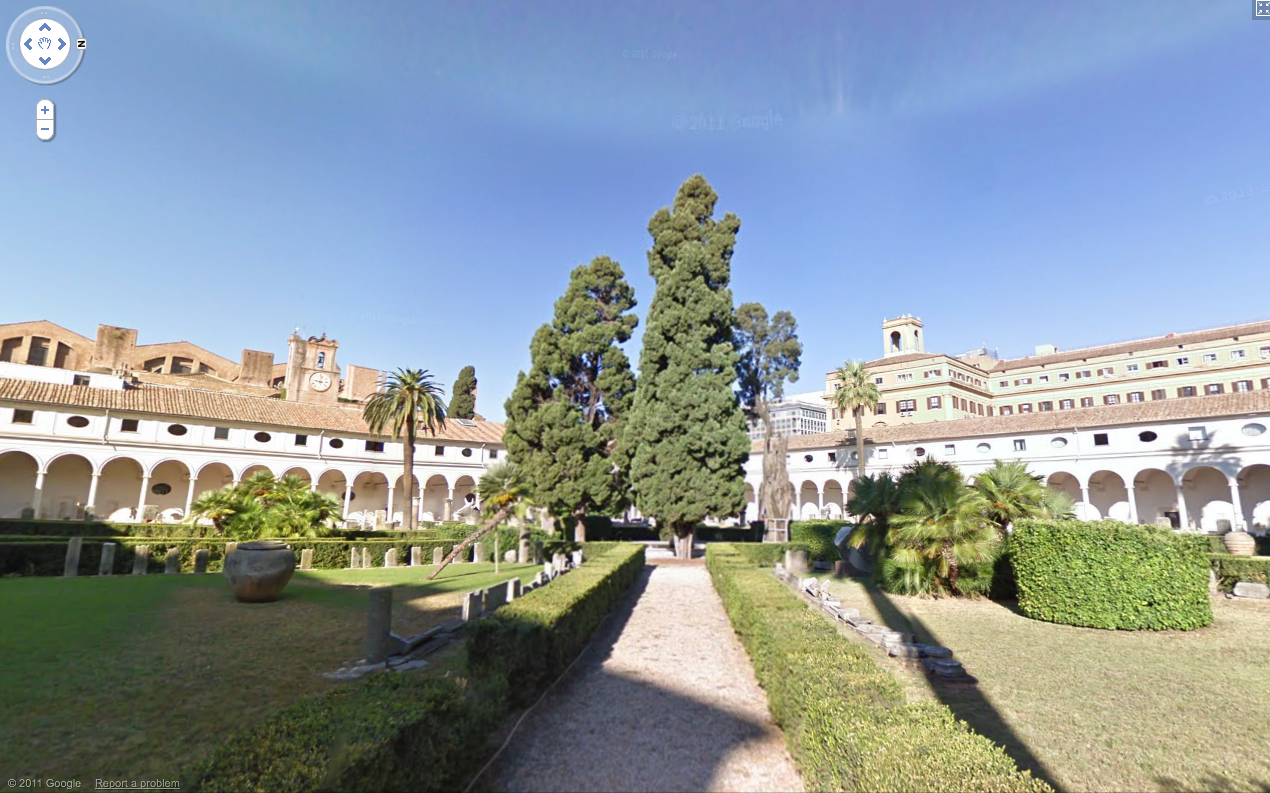
In few clicks you can navigate through centuries of history. Start at the birthplace of Rome, the Palatine Hill, where the mythical founders of the city, Romulus and Remus were found and saved by a she-wolf, and where the most ancient buildings of the city are located. Follow the Appian Way, a little path that became one of the most strategically important roads of ancient Rome. After the long walk, experience the splendor of Imperial Rome at the Thermae (Baths) of Diocletian—ancient wellness and cultural centers with 33 acres of pools, gymnasiums and public libraries.

Baths of Diocletian

After wandering around Rome, you can fast forward in time to witness the celebrated architectural wonders of the Italian Renaissance, including Giotto’s Campanile (bell tower) and Brunelleschi’s Cupola (dome) in Santa Maria del Fiore in Florence. While in Florence don’t miss the opportunity to walk through Ponte Vecchio and shop at the famous artisan jewel stores built on top of it!

Santa Maria del Fiore, Florence

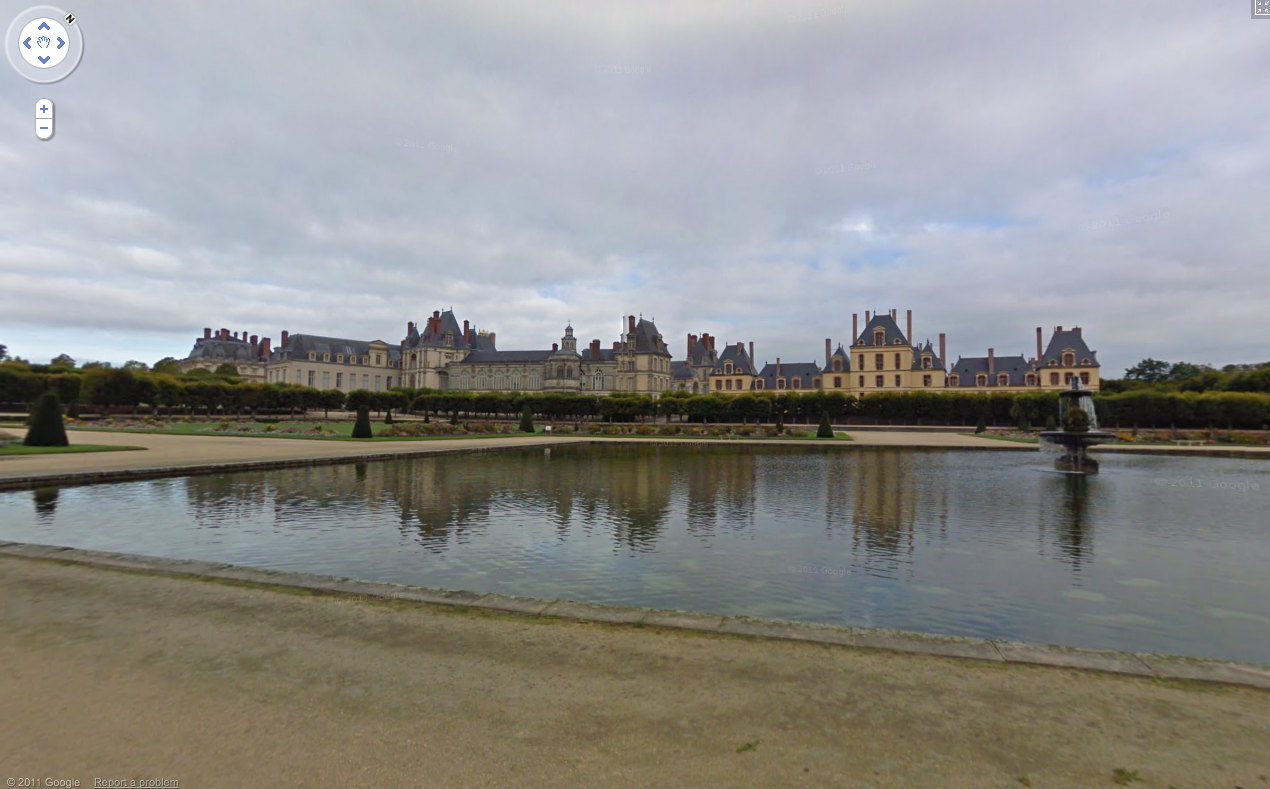
In France, you can view picturesque chateaux and indulge your fantasies of living like French royalty by taking a virtual stroll around the beautiful Fontainebleau.

Château de Fontainebleau

Start exploring these sites in our Street View gallery, or find your favorite historic spots directly in Google Maps.

Ozone levels dropped by as much as half in the past year

Check out the stark difference between these two satellite images, taken on March 19, 2010 and March 19, 2011. The left image shows much more ozone (in red) over the Arctic than the right image. What’s happened?

These maps come from NASA’s Ozone Monitoring Instrument (OMI), aboard the Aura satellite. The two images tell a stark tale of rapid ozone depletion. OMI uses a spectrometer that measures the amount of sunlight scattered by Earth’s atmosphere and surface, which gives a sense of how much ozone exists at different levels, including the stratosphere.

Here’s an animation which shows the dynamics of the ozone layer from January 1 to March 23 in both 2010 and 2011:

In mid-March, scientists from the Alfred Wegener Institute reported that Arctic ozone levels had been cut in half towards the end of winter, based on data from 30 ozone-sounding stations around the region.

The good news is, Arctic ozone levels fluctuate from year to year, and ozone “holes” don’t form as consistently as they do in the Antarctic. It remains to be seen whether this ozone depletion will actually lead to increases in the intensity of ultraviolet radiation in the Arctic. Says Paul Newman with NASA’s Goddard Space Flight Center, “We need to wait and see if this will actually happen… It’s something to look at but it is not catastrophic.”

But still, the question of why ozone levels dropped so starkly this year remains, and nobody has a good answer. There are still a lot of ozone-depleting chemicals like CFCs in the atmosphere, despite their regulation by the Montreal Protocol. It’ll take a long time for the concentration of these chlorines to decline, because these chemicals have a long lifespan. And the process of ozone depletion is intensified when the stratosphere is especially cold, which has been the case in recent weeks.

Says Newman:

Last winter, we had very high lower stratospheric temperatures and ozone levels were very high; this year is just the opposite. The real question is: Why is this year so dynamically quiet and cold in the stratosphere? That’s a big question with no good answer.