In the past few weeks, Google has added a ton of new data and information related to the earthquake and tsunami that struck Japan. Much of that information is summarized here for you.
However, all of that has come in the form of add-ons to Google Earth, such as image overlays. In an effort to post data quickly, that is their best option. However, Google has now made their first major update to the base layer imagery with some brand new imagery from the area around Sendai:
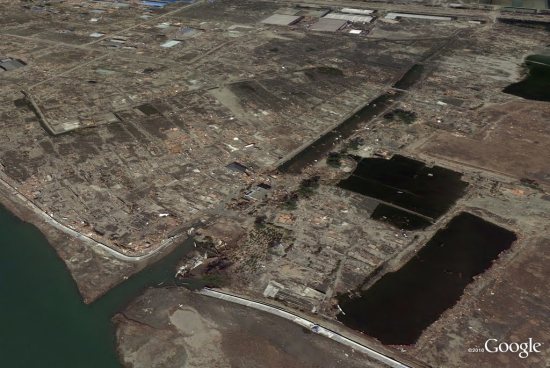
The imagery was collected this past Sunday and Monday, so it was very quick work for them to get it posted already! You can visit Sendai to see it for yourself by flying there using this KML file .
.
Google is planning to publish more fresh imagery in the near future, and you can read more about that over on their Lat Long Blog.