NSW election map

Last weekend NSW voters went to the polls to choose the new State government. As was widely anticipated, coalition parties – Liberals and Nationals have won overwhelming majority of seats. The extent of Labor’s defeat can be best gauged by looking at a map which shows electorates coloured according to a winning party. Blue, traditional colour associated with the Coalition, covers almost the entire State of NSW, with only a few islands of red depicting Labor held electorates. The map was created by Sydney Morning Herald to report on the progress of election results.
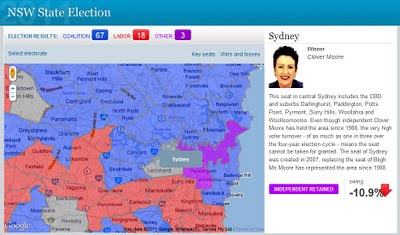

The map is quite intuitive to use – just move the mouse over the polygon to reveal electorate name and click on a polygon to bring additional information about the electorate in a side panel. As polygons are created from point data they can be highlighted on mouse over. The downside of this approach is that, because of the limit on how many points browsers can handle, developers had to sacrifice the quality of boundary outlines, keeping points to a minimum. The effects are gaps and overlaps in individual polygons when you zoom too close.

As noted in GIS related media, this was the only map used in reporting election results in NSW. Why this lack of interest to commit resources and present “the battlefield” spatially? I suspect that it may have something to do with the availability of State electoral boundary data – a quick search on the Internet did not yield any results. Creating such boundaries from secondary information sources may have proven too big of a task.
Google earth: Imagery Update (and Kansas Basketball)

We’re in the middle of college basketball Madness here in the U.S. and the best is yet to come. Tomorrow night, the Kansas Jayhawks will play the Richmond Spiders in a Sweet Sixteen match-up at the Alamodome in Texas. I’ll proudly admit that I’m a Kansas fan and hoping to see my home team make it to the Finals. But I’m not the only college hoops fan at Google. In fact, our Geo team put together a special page that shows an up-to-date schedule with schools and stadiums.

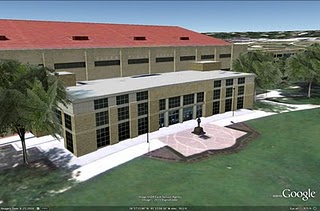
In our latest imagery push, we (coincidentally) added new imagery of Lawrence, Kansas and a new 3D model of the Allen Fieldhouse, possibly the best basketball venue on Earth. As a longtime Lawrence resident and KU alumnus, I still remember my first games in the “Phog” when I was in junior high school, watching from the upper bleachers. The Fieldhouse has aged well with the new Booth Family Hall of Athletics and the parking additions.


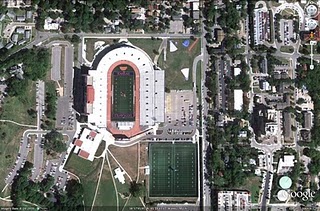
When I’m feeling like I need even more of a dose of home, it’s also great to be able to check out some of my favorite places back in Lawrence through Google Earth and Google Maps. With the new high-resolution aerial imagery, you can now see many changes including the updates to Memorial Stadium and the large practice fields.


Additional basketball-related updates include Gainesville (Florida), Tallahassee (Florida State), and Manhattan, the Little Apple (Kansas State [5]). We’ve also updated many other locations around the world that can be seen and discovered in our latest batch of published imagery including major updates in Sydney, Tokyo, Stockholm and significant parts of Ireland.

High Resolution Aerial Updates:
USA: Boca Raton, FL; West Palm Beach, FL; Port St Lucie, FL; Crystal River, FL; Ocala, FL; Gainesville, FL; Tallahassee, FL; Valdosta, GA; Savannah, GA; Jackson County, GA; Bedford County, PA; Cumberland County, PA; Manhattan, KS; Topeka, KS; Lawrence, KS
Wales: Northern Half
Scotland: Hawick
Japan: Tokyo; Kawasaki; Yokosuka
Australia: Sydney, Brisbane, Canberra

Countries/Regions receiving High Resolution Satellite Updates:
Antarctica, United States, Canada, Mexico, Cuba, Haiti, Dominican Republic, El Salvador, Panama, Bolivia, Paraguay, Brazil, Argentina, South Africa, Madagascar, Namibia, Zimbabwe, Zambia, Angola, Tanzania, Kenya, Burundi, Rwanda, Democratic Republic of the Congo, Uganda, Ethiopia, Sudan, Central Africa, Niger, Ivory Coast, Togo, Liberia, Senegal, Morocco, Algeria, Tunisia, Egypt, Israel, Jordan, Syria, Saudi Arabia, Bahrain, Qatar, United Arab Emirates, Kuwait, Yemen, Iran, Pakistan, Tajikistan, India, Bangladesh, China, Myanmar, Thailand, Taiwan, North Korea, Japan, Mongolia, Indonesia, Australia, New Zealand, Russia, Georgia, Armenia, Azerbaijan, Turkey, Greece, Bulgaria, Romania, Ukraine, Hungary, Austria, Poland, Croatia, Italy, Germany, Switzerland, France, Spain, Portugal, Ireland, Norway, Sweden, Finland, Greenland

These updates are now available in both Google Maps and Google Earth. To get a complete picture of where we updated imagery, download this KML for viewing in Google Earth.

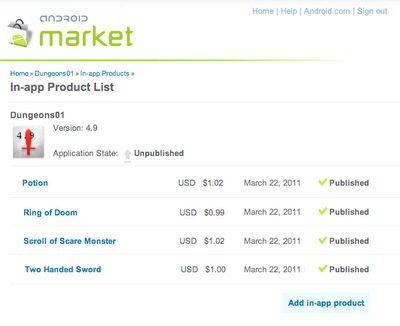
In-App Billing on Android Market: Ready for Testing

We announced our plan to introduce Android Market In-app Billing this quarter. We’re pleased to let you know that we will be launching In-app Billing next week.

In preparation for the launch, we are opening up Android Market for upload and end-to-end testing of your apps that use In-app Billing. You can now upload your apps to the Developer Console, create a catalog of in-app products, and set prices for them. You can then set up accounts to test in-app purchases. During these test transactions, the In-app Billing service interacts with your app exactly as it will for actual users and live transactions.

Note that although you can upload apps during this test development phase, you won’t be able to actually publish the apps to users until the full launch of the service next week.

To get you started, we’ve updated the developer documentation with information about how to set up product lists and test your in-app products. Also, it is absolutely essential that you review the security guidelines to make sure your billing implementation is secure.

We encourage you start uploading and testing your apps right away.