London Riots Map: Visualising correlations on maps

Correlation is a statistical technique very often used in data analysis. It can show whether and how strongly pairs of variables are related. It normally involves lots of mathematical calculations but a quick insight into the phenomenon under investigation can be gained by simply superimposing the data on a map, if both datasets have a common spatial component (eg. location).

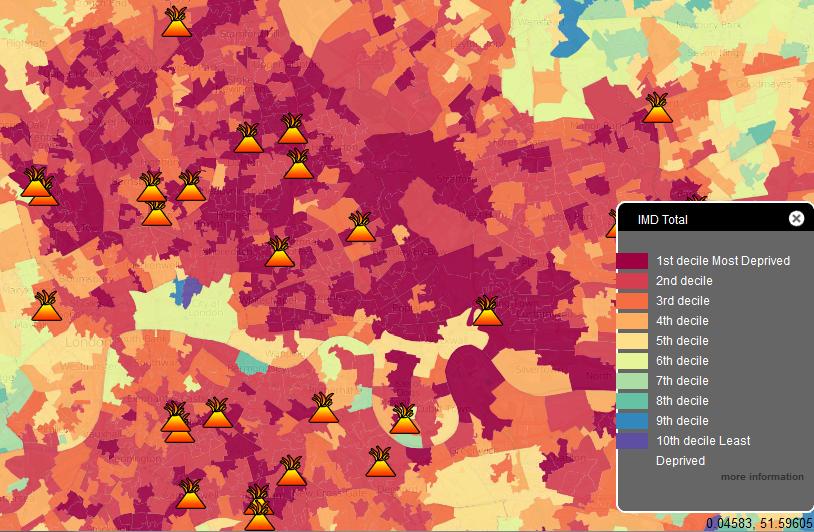
Take, for example, a case of recent London riots, mapped on MapTube. Overlaying locations of civil commotions with Index of Deprivation (ie. a measure of poverty) allows drawing a hypothesis that poverty and propensity to violent demonstrations are related. The correlation may not necessary be obvious when analysing each dataset in isolation and in a numerical form.

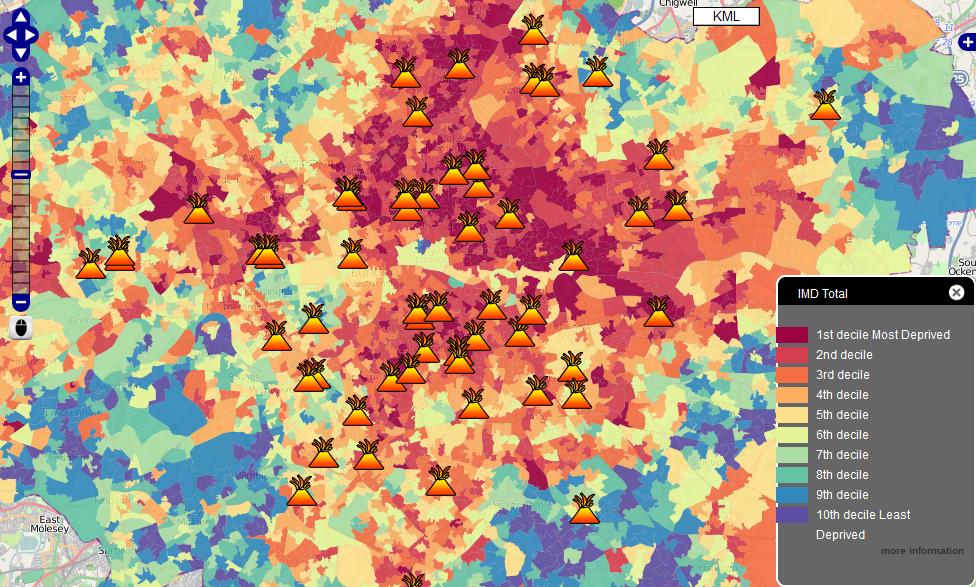
A point to note however is that, if the two variables are said to be correlated they may or may not be the cause of one another. In other words, correlation does not imply causality. The correlation phenomena could be caused by a third, previously unconsidered phenomenon, called a lurking variable or confounding variable. For this reason, there is no way to immediately infer the existence of a causal relationship between the two variables. Hence, one should not jump to the conclusion that “poverty is a major factor contributing to London riots” without examining the phenomenon in more detail.

As a side note, I am very surprised to see so much “red” on the London map, implying that the majority of central suburbs are poverty stricken areas – with only a few pockets of wealth on the city fringes. This picture is in big contrast to Sydney where underprivileged areas are concentrated mainly in the south-western part of the city and, most importantly, account only for roughly a quarter of the overall metropolitan area. Australia indeed seems to be a very lucky country…

London Riots Map first spotted on Google Maps Mania

Now 3D buildings in Google Earth for Android tablets!

Google Earth on mobile devices just took a big step forward with the release of Google Earth 2.0 for Android, with a special emphasis on tablets. It has some great new features, but is still lacking some of the features that we were hoping for.

The big addition to this release is 3D buildings! Every 3D building that you can view on your desktop is now available on your Android tablet. The buildings use the same high quality texture as the desktop version, though there’s no anti-aliasing built-in so things can look a bit choppy around the edges.

Curiously, it doesn’t appear to load any of the gray buildings from Google Earth — only the ones that are textured. Nor do any of the new 3D trees load, though that’s not a big surprise at this point.

In addition, they’ve worked on the “action bar” at the top of the screen to make it easy to search for locations, toggle layers, reorient yourself, etc. It’s very well done.

Other nice new features include the new content pop-ups when viewing items like photos, as shown here:

colosseum.png

The photo feature is nice, but it’s difficult to view the picture full-size. Rather than clicking the photo itself, you need to click the small Panoramio link below it. Not very intuitive, though the overall photo viewing experience is quite nice.

In terms of performance, it certainly doesn’t run quite as smoothly when you’ve got the buildings enabled, but it holds up quite well. Much of that will be based on the capabilities of your tablet, but the Xoom with its dual-core processor handles things quite well. It’s very apparent that they worked hard to optimize performance on this version.

The only real downside is that they’ve ignored most of Frank’s list of things the tablet version should have, specifically KML support. Having some degree of KML support on the tablet version would be quite nice, and I’m sure we’ll see it someday. We believe that the new Android tablets are fully capable of supporting all of the features from the desktop version, and it’s a matter of Google taking the time to port those features over.

If you have a Xoom, or one of the other few Android 3.0-enabled tablets, give it a shot and let us know what you think!

New Google Docs app for Android

People are using mobile phones to access information — from email to web browsing to editing documents. Part of getting work done on the go is being able to easily access, edit and share content, which is why we’re happy to announce the new Google Docs app for Android.

With this new app it’s easy to filter and search for your content across any Google account, then jump straight into editing docs using the online mobile editors. The app also allows you to easily share items with contacts on your phone, right from within the app.

The Docs app also allows you to upload content from your phone and open documents directly from Gmail. You can also add a widget to your home screen for easy access to three core tasks: jumping to your starred documents, taking a photo to upload, or creating a new document with one tap.


And my favorite feature: Using the app and your phone’s camera, you can turn photos with text into editable Google documents with the power of optical character recognition (OCR). Just create a new ‘Document from Photo’ or select the camera icon from the widget, and your converted document will appear in your documents list shortly after you snap the picture. You can also convert photos already stored on your phone by sharing them with the Google Docs app. OCR does a pretty good job capturing unformatted text in English but won’t recognize handwriting or some fonts – stay tuned, it will get better over time!


The Google Docs app is currently available in English and works on Android 2.1+ phones. Try it out by scanning the QR code below or by visiting Android Market.


Tested on Samsung Galaxy S!