From c-base in Berlin to the Ice Bar in Stockholm, from four courses of pasta in Florence to beer and pretzels in Munich, and from balalikas in Moscow to metal cage mind puzzles in Prague – one common theme was the enthusiasm and quality of the Android developers in attendance. You guys are epic.
For those of you who couldn’t join us, we’re in the middle of posting all the sessions we presented during this most recent world tour. Stand by for links.
Droidcon UK
We kicked off our conference season at Droidcon UK, an Android extravaganza consisting of a bar camp on day 1 and formal sessions on day 2. It was the perfect place for the Android developer relations team to get together and kick off three straight weeks of Google Developer Days, GTUG Hackathons, and Android Developer Labs.
Android Developer Labs
The first of our Android Developer Labs was a return to Berlin: home to c-base (a place we never got tired of) and the Beuth Hochschule für Technik Berlin. This all day event cost me my voice, but attracted nearly 300 developers (including six teams who battled it out to win a Lego Mindstorm for best app built on the day.)
Next stop was Florence which played host to our first Italian ADL after some fierce campaigning by local Android developers. 160 developers from all over Italy joined us in beautiful Florence where the Firenze GTUG could not have been more welcoming. An afternoon spent with eager developers followed up by an evening of real Italian pasta – what’s not to love?
From the warmth of Florence to the snow of Stockholm where we joined the Stockholm GTUG for a special Android themed event at Bwin Games. After a brief introduction we split into six breakout sessions before the attendees got down to some serious hacking to decide who got to bring home the Mindstorm kit.
Google Developer Days
The Google Developer Days are always a highlight on my conference schedule, and this year’s events were no exception. It’s a unique opportunity for us to meet with a huge number of talented developers – over 3,000 in Europe alone. Each event featured a dedicated Android track with six sessions designed to help Android developers improve their skills.
It was our first time in Munich where we played host to 1200 developers from all over Germany. If there was any doubt we’d come to the right place, the hosting of the Blinkendroid Guinness World Record during the after-party soon dispelled it.

Moscow and Prague are always incredible places to visit. The enthusiasm of the nearly 2,500 people who attended is the reason we do events like these. You can watch the video for every Android session from the Prague event and check out the slides for each of the Russian sessions too.
GTUG Hackathons
With everyone in town for the GDDs we wanted to make the most it. Working closely with the local GTUGs, the Android and Chrome teams held all-day hackathon bootcamps in each city the day before the big event.
It was a smaller crowd in Moscow, but that just made the competition all the more fierce. So much so that we had to create a new Android app just for the purpose of measuring the relative volume of applause in order to choose a winner.
If a picture is a thousand words, this video of the Prague Hackathon in 85 seconds will describe the event far better than I ever could. What the video doesn’t show is that the winners of “best app of the day” in Prague had never developed for Android before.
In each city we were blown away by the enthusiasm and skill on display. With so many talented, passionate developers working on Android it’s hard not to be excited by what we’ll find on the Android Market next. In the mean time, keep coding; we hope to be in your part of the world soon.
On To South America
[Thanks, Reto. This is Tim again. The South American leg actually happened before the Eurotour, but Reto got his writing done first, so I’ll follow up here.]
We did more or less the same set of things in South America immediately before Reto’s posse fanned out across Europe. Our events were in São Paulo, Buenos Aires, and Santiago; we were trying to teach people about Android and I hope we succeeded. On the other hand, I know that we learned lots of things. Here are a few of them:
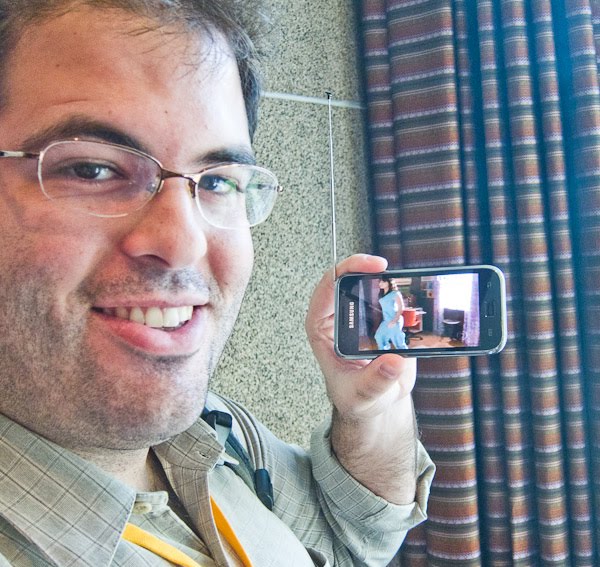
- Wherever we went, we saw strange (to us) new Android devices. Here’s a picture of a Brazilian flavor of the Samsung Galaxy S, which comes with a fold-out antenna and can get digital TV off the air. If you’re inside you might need to be near a window, but the picture quality is fantastic.
- There’s a conventional wisdom about putting on free events: Of the people who register, only a certain percentage will show up. When it comes to Android events in South America, the certain-percentage part is wrong. As a result, we dealt with overcrowded rooms and overflow arrangements all over the place. I suppose this is a nice problem to have, but we still feel sorry about some of the people who ended up being overcrowded and overflowed.
- Brazilians laugh at themselves, saying they’re always late. (Mind you, I’ve heard Indians and Jews and Irish people poke the same fun at themselves, so I suspect lateness may be part of the human condition). Anyhow, Brazilians are not late for Android events; when we showed up at the venue in the grey light of dawn to start setting up, they were already waiting outside.
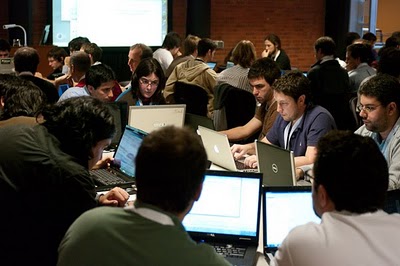
- I enjoyed doing the hands-on Android-101 workshops (I’ve included a picture of one), but I’m not sure Googlers need to be doing any more of those. Wherever you go, there’s now a community of savvy developers who can teach each other through the finer points of getting the SDK installed and working and “Hello World” running.
- Brazil and Argentina and Chile aren’t really like each other. But each has its own scruffy-open-source-geek contingent that likes to get together, and Android events are a good opportunity. I felt totally at home drinking coffee with these people and talking about programming languages and screen densities and so on, even when we had to struggle our way across language barriers.
The people were so, so, warm-hearted and welcoming and not shy in the slightest and I can’t think about our tour without smiling. A big thank-you to all the South-American geeks and hackers and startup cowboys; we owe you a return visit.
 was developed which allows users to interact with landscape plans, historic and modern photos, and GIS overlays. Clicking on some of the historic photos and drawings will link you to the documentation archived at the Library of Congress.