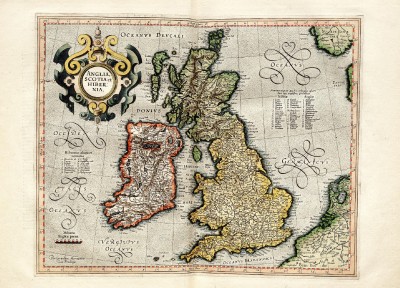
The Art of Maps: Map of Anglia,Scotia and Hibernia from Atlas sive Cosmographicae by Gerardus Mercator (1595)

Britania From Mercator 47 page | mapsys.info

Atlas sive Cosmographicae by Gerardus Mercator (1595)

The Fleming Gerard Mercator (1512-1594) is rightfully regarded as the most important scientific cartographer of the Renaissance. With two contemporaries, the geographer Abraham Ortelius and the printer and publisher Christoffel Plantijn,he is considered the father of commercial cartography in the Netherlands.Even during his lifetime his maps, globes and atlases found their way all over the world.Mercator established his reputation mainly through his new projection method. The meridians and parallels are positioned at right angles to each other.If the distances between the meridians are equal, they progressively become larger between the parallels from the equator to the poles.This is why the latitude becomes wider the closer you get to one of the poles and why the part of the Earth in the upper latitudes exhibits excessive proportions.The advantage of this method was the far greater degree of certainty and accuracy in determining shipping routes.In 1585, Mercator published the first three parts of his own book of maps in one volume,which he called Atlas.The second edition appeared in 1589, with the addition of a fourth part. The first complete edition was compiled by his heirs in 1595 one year after his death.Walter Ghim,mayor of Duisburg the city where Mercator had lived for a long time,wrote the accompanying Mercator biography.It was the first time that a book of maps was referred to as an Atlas.Commercially speaking,however,the Atlas was not a success thanks to formidable competition from the Theatrum orbis terrarum by Abraham Ortelius,published in 1570,which by the end of the century had been reprinted more than twenty times.

The Art Of Maps:

The Art of Maps: Map of America from Atlas sive Cosmographicae by Gerardus Mercator (1595)
The Art of Maps: Europa Delineata juxta Obfervationes Excellorum – Vindel 1760
The Art of Maps: PIRI REIS MAP
The Art of Maps: Map of Europe from Atlas sive Cosmographicae by Gerardus Mercator (1595)
The Art of maps: John Speed: Asia with the Islands adioyning described, the atire of the people, & Townes of importance, all of them newly augmented . . . 1626
The Art of Maps:Johann Baptiste Homann [California as an Island]
The Art of maps:Matthias Quad – Map of North America 1593
The Art of Maps: Americae Nova Tabula
Sightseeing Map Locations Bulgaria
The Art of Maps: CORNELIS DANCKERTS Nieuw Aerdsch Pley MAP
7 милиона SMS-а за Нова година

По Нова година са изпратени близо 7 милиона кратки текстови съобщения, съобщава един от операторите в България.

След 22 часа на 31 декември 2010 година клиентите на оператора са изпратили над 180 хиляди SMS-а.

В първия ден на 2011-та година в мрежата на телекома са изпратени новогодишни пожелания в 6 574 453 съобщения, а до 11.00 часа на 2 януари броят на SMS-ите е 207 820.

Увеличават се броят на клиентите, предпочели да поздравят близки и приятели с MMS-и.

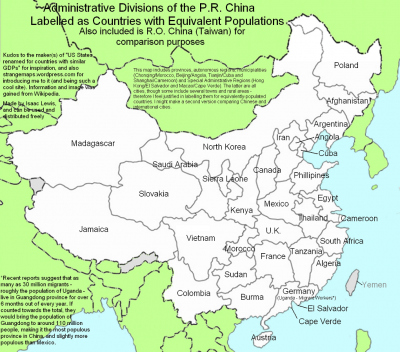
The Population of China’s Provinces Compared

China is the world’s most populous nation . That much anybody knows. But even if we know a bit more (that the number of Chinese is around 1.32 billion, which is just under 20% of all humans alive today), that figure is still too big to mean much beyond that China is ‘number one’ . This map compares the population of China’s provinces (plus the ‘renegade province’ of Taiwan), autonomous regions and municipalities with those of whole countries, and thus helps shed some light on that issue.

Here, for easy reference, is a list in descending order of magnitude of those Chinese territories (their population in brackets) followed by the foreign country they compare to.

Guangdong (113 million) Germany plus Uganda
Henan (99 million) Mexico
Shandong (92 million) Philippines
Sichuan (87 million) Vietnam
Jiangsu (75 million) Egypt
Hebei (68 million) Iran
Hunan (67 million) France
Anhui (65 million) Thailand
Hubei (60 million) U.K.
Guangxi (49 million) Burma/Myanmar
Zhejiang (47 million) South Africa
Yunnan (44 million) Colombia
Jiangxi (43 million) Tanzania
Liaoning (42 million) Argentina
Guizhou (39 million) Sudan
Heilongjiang (38 million) Poland
Shaanxi (37 million) Kenya
Fujian (35 million) Algeria
Shanxi (33 million) Canada
Chongqing (31 million) Morocco
Jilin (27 million) Afghanistan
Gansu (26 million) Saudi Arabia
Inner Mongolia (24 million) North Korea
Taiwan (23 million) Yemen
Xinjiang (20 million) Madagascar
Shanghai (18 million) Cameroon
Beijing (16 million) Angola
Tianjin (12 million) Cuba
Hainan (8 million) Austria
Hong Kong (7 million) El Salvador
Ningxia (6 million) Sierra Leone
Qinghai (5 million) Slovakia
Tibet (3 million) Jamaica
Macau (0,5 million) Cape Verde
Some obvious conclusions (from a non-expert, non-Chinese point of view):

Most of China’s main administrative subdivisions are literally unheard-of in the rest of the world, save for some obvious exceptions like Tibet, Beijing, Shanghai and Hong Kong.
The names of some provinces sound especially indistinguishable (or at least are rather indistinct to western ears): Hebei and Hubei; Shanxi and neighbouring Shaanxi; not to mention Jiangxi and Guangxi; or Hainan, Hunan and Henan.
The well-known pattern of heavy population density on the coast and lesser density inland belies the fact that even in the most far-flung provinces, the populations are not exactly tiny (Xinjiang: 20 million, Inner Mongolia: 24 million), Heilongjiang: 38 million, Yunnan: 44 million), except in Qinghai (5 million) and Tibet (3 million).
This map was sent in by Isaac Lewis, who was “inspired by the map that did something similar for US states and international GDPs (here and here) in order to “get a perspective on just how many people 1.3 billion actually is.”

“Mostly the provinces and their labels are very close in population,” Mr Lewis explains. “The largest difference is between Henan province (98.7 million) and Mexico (106.7 million). Other than that, they’re mostly within 1 or 2 million of each other.”