The historic and cultural sites of Mexico

Nothing compares to the sensation of visiting a place where history was made. Exploring castles, pyramids and other historical landmarks in a country provokes a deeper understanding and respect for unique cultures and creates a sense of belonging. Today, technology enables us to expand our horizons in a matter of clicks, bringing foreign cultures and history to us from around the world.

Mexico is a country full of natural beauty and cultural heritage. It’s archaeological sites attract hundreds of thousands of tourists each year. Today, we are making these historical landmarks more accessible than ever by bringing an interactive atlas from the National Institute of Anthropology to Google Earth.

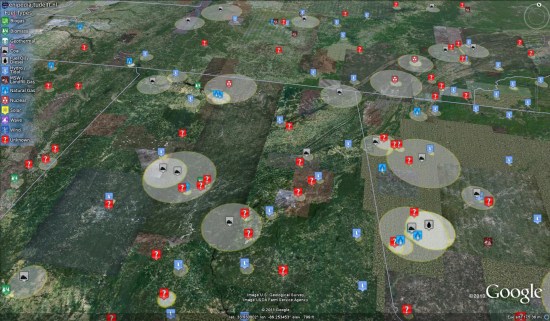
Download the new KML file of this historical archive to view geo-referenced scale models (many in 3D) of monuments, archaeological sites, museums and other buildings that make up the cultural heritage of Mexico.

View the historic and cultural sites that make up Mexico’s history from anywhere in the world.
Through Google Earth, you can virtually visit 416 locations across Mexico, including 182 archaeological sites, 116 museums, 31 world heritage sites, 83 3D models and 4 schools. Many of the models presented in this interactive guide were created through the ‘Put Mexico on the map’ competition recently hosted by Google and the National Institute of Anthropology.

Learn more about this effort that helps bring Mexico’s history to life by visiting www.OneWorldManyStories.com. We hope this new resource makes it fun to both learn about Mexico’s rich cultural heritage and plan your next Mexican vacation.

The earthquake tsunami changed the Ice


When the earthquake (and subsequent tsunami) struck Japan earlier this year, we provided as much data as possible about the disaster. What many people didn’t realize was that the tsunami continued to travel across the ocean, eventually striking Antarctica with a great deal of force. This caused some flexing and breaking of the Sulzberger Ice Shelf, which resulted in two large icebergs being released, reminicient of the chunk of the Wilkins Ice Shelf that broke off a few years ago. Combined, the icebergs cover an area of 125 square kilometers, or more than twice the size of New York’s Manhattan Island!


sulzberger_sar_2011075.jpg 


You can download the KMZ file here.

If you turn on the “Borders and Labels” layer in Google Earth, you’ll see the yellow outlines match up quite well with the dark patches in the overlay, as seen here:


overlay.jpg 


Google Earth: 50,000 power plants


Enipedia is a wiki-based source for energry and industrial information. They have quite a comprehensive site, and they’ve just added some Google Earth tools that are very impressive.

In particular, their Power Plants tool does some neat things. At the basic level, it produces a Google Earth KML file that allows you to view over 50,000 power plants across the globe.


power.jpg 

The icons on the map represent the fuel types used at each power plant, and the size of the circle around each plant is a representation of their electrical power output (MWh). Much of the data has come from sources such as carma.org, eGRID and E-PRTR.

An especially interesting piece of this is that it’s wiki-based, meaning anyone can edit it. As they mention in the Google Earth Community, they run a script that is continually updating the KML with the latest information. This is a great way to take crowd-sourced information and display it for all to see. The KML that you download is actually a network link file, so it can always be updated with the latest information.