For a while now, the SketchUp sales team has been working on an important side project: We’re on a mission to collect cities’ 3D model data sets to add to Google Earth and Maps. Adding photo-textured or even gray building data can improve the way cities are visualized. Last year we worked with the Town of Banff (in Alberta, Canada) to get a 3D model of their municipality into Google Earth and Maps.
The Town of Banff realizes the power of location and how it can benefit our residents and visitors alike. By contributing our town-wide 3D building outlines to Google’s Cities in 3D program, we’re able to visualize the town in a way that just can’t be conveyed using traditional media.
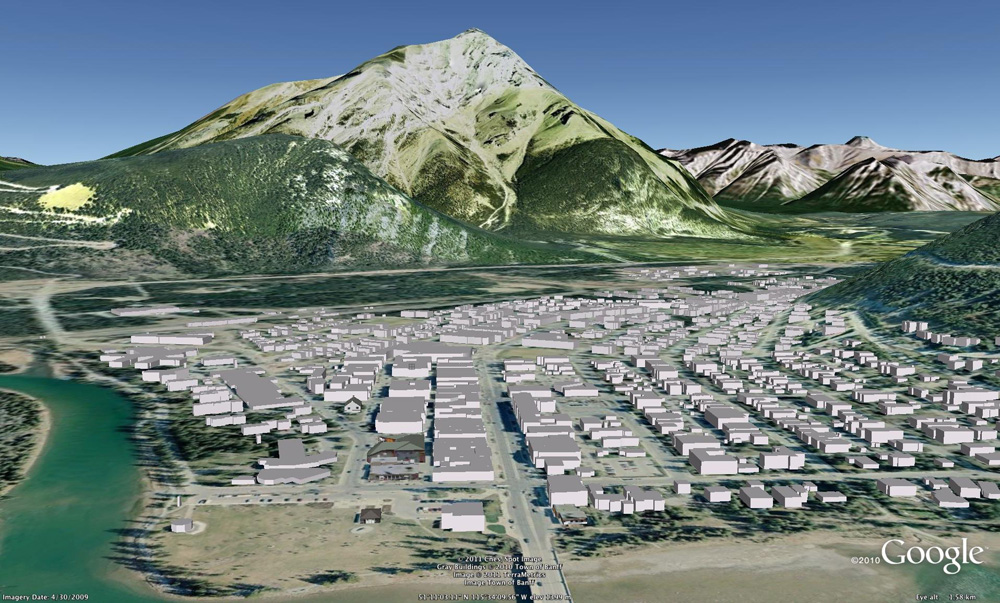 Banff, Alberta in Google Earth, visualized with contributed gray building data
Visitors can fly right down to street level; turning buildings on and off gives them the ability to choose lodgings that offer amazing views of Banff National Park and the majestic Rocky Mountains. It also allows people who aren’t familiar with the layout of the town to get a feel for the streets and services before they arrive. We have Banff’s Roam transit system tied into Google Earth so visitors can see what’s located around each stop — and even when the next bus is scheduled to arrive!
 Starting with gray extrusions often motivates geo-modelers to replace prominent buildings with full-fledged 3D models made in SketchUp.
3D building modelling also allows town planners and decision makers the ability to do some basic streetscape analysis and use the 3D capabilities in important project presentations such as the Town of Banff Signage and Wayfinding project. We are slowly applying facades to building shapes. Examples include the Town Hall and the Canada Post office. The feedback we’ve received from the few buildings we’ve completed have been very positive!
You can submit your town or city’s models for inclusion in Google Earth. Read about the Cities in 3D program to learn all about it.

