Get more out of Google Maps with their improved places pages. We’ve got details on this cool new feature that will have you loving Google Maps even more!
Perth bushfires
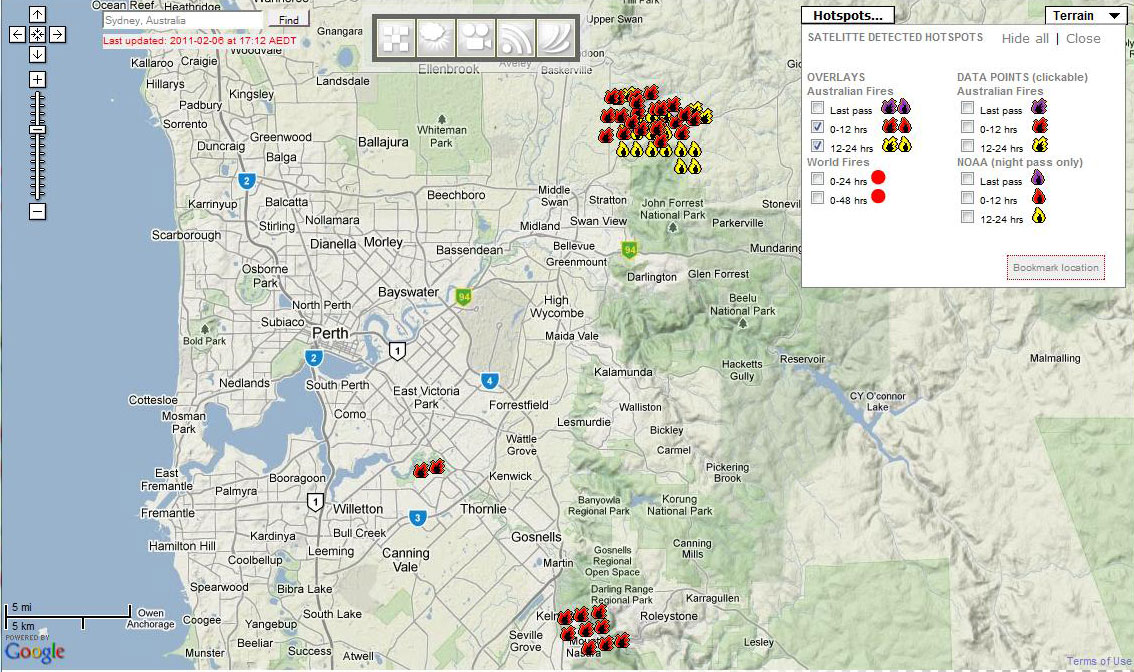
From one extreme to another… today top news is bushfires in WA and on the outskirts of Perth. Tens of houses have already been lost. Alerts are published by Fire and Emergency Services WA and the Department of Environment and Conservation. I was looking for online maps but could not locate anything with exception of the good old FireWatch. So, here is a couple of screen captures from aus-emaps.com Bushfire Incidents map:

Interestingly, DEC publishes number of hits on its online reports and numbers are quite surprising… high tens but no more than 200. There is lots of text, occasional situation map in pdf but overall not an easy read… It appears that despite all the initiatives, by the community, the governments of all levels, academics, media and private companies there is still no single “geographic information system” available for the public to see first hand what is happening in near real time. There is still a big void in information. Why? Is lack of funding the main issue or lack of coordinated approach by various authorities? Or lack of enthusiasm to carry on development and support for something that may only be used a few days a year (…every few years!)? It would be interesting to hear from others what do you think …
End Note:
The latest community initiative called Bushfire Connect will be officially launched on Monday 7th February, initially focusing only on Victoria.
Another disaster looming for Oz
After devastating floods in January 2011 Queensland is now bracing for the impact of category 5 cyclone Yasi. It is expected to hit Australian coast somewhere between Innisfail and Cardwell at about 11pm EST this evening, with winds over 200km/h. Emergency Management Queensland issued warnings that Yasi can cause “extensive damage and result in death or injury caused by flooding, buildings collapsing or flying debris.” The wind has already picked up to 93 km/h at Hamilton Island airport (6 pm AEDT).
Australian Bureau of Meteorology warns about “EXTREMELY DANGEROUS SEA LEVEL RISE [i.e. storm tide]… EXTREMELY DAMAGING WAVES, STRONG CURRENTS and FLOODING” as the cyclone approaches. Between Port Douglas and Ayr the winds will become DESTRUCTIVE with gusts in excess of 125 km/hr. Cyclone Yasi is expected to reach inland as far as Mt Isa.
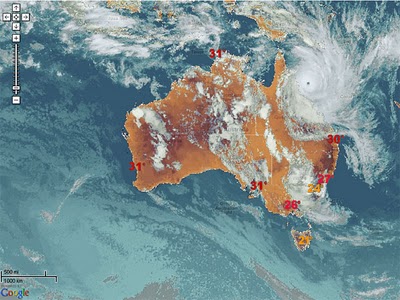
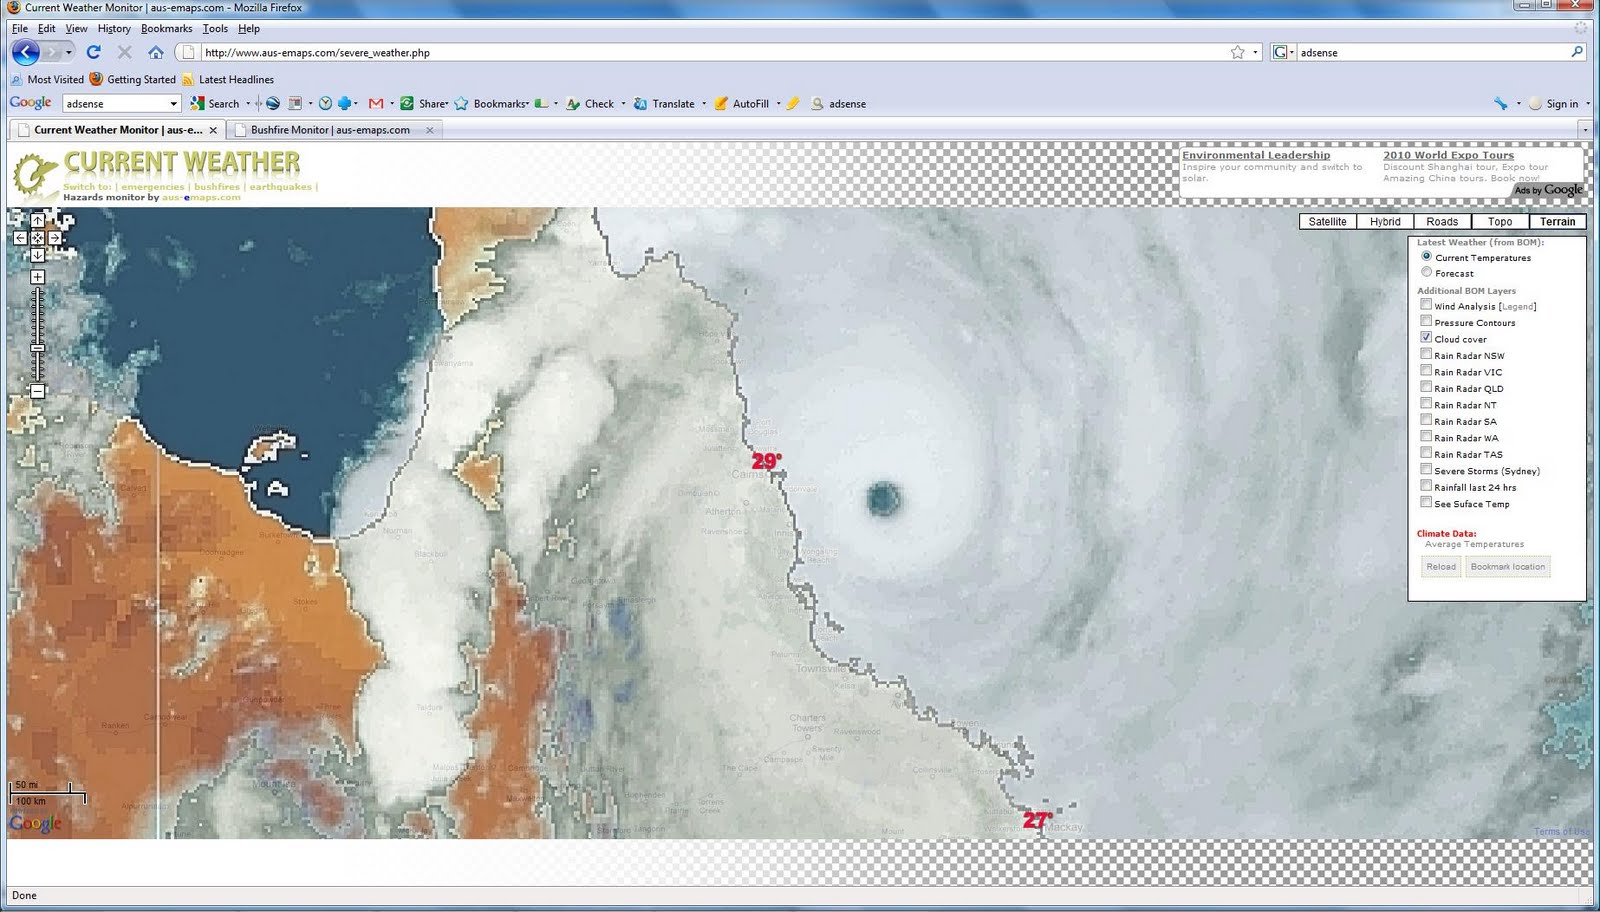
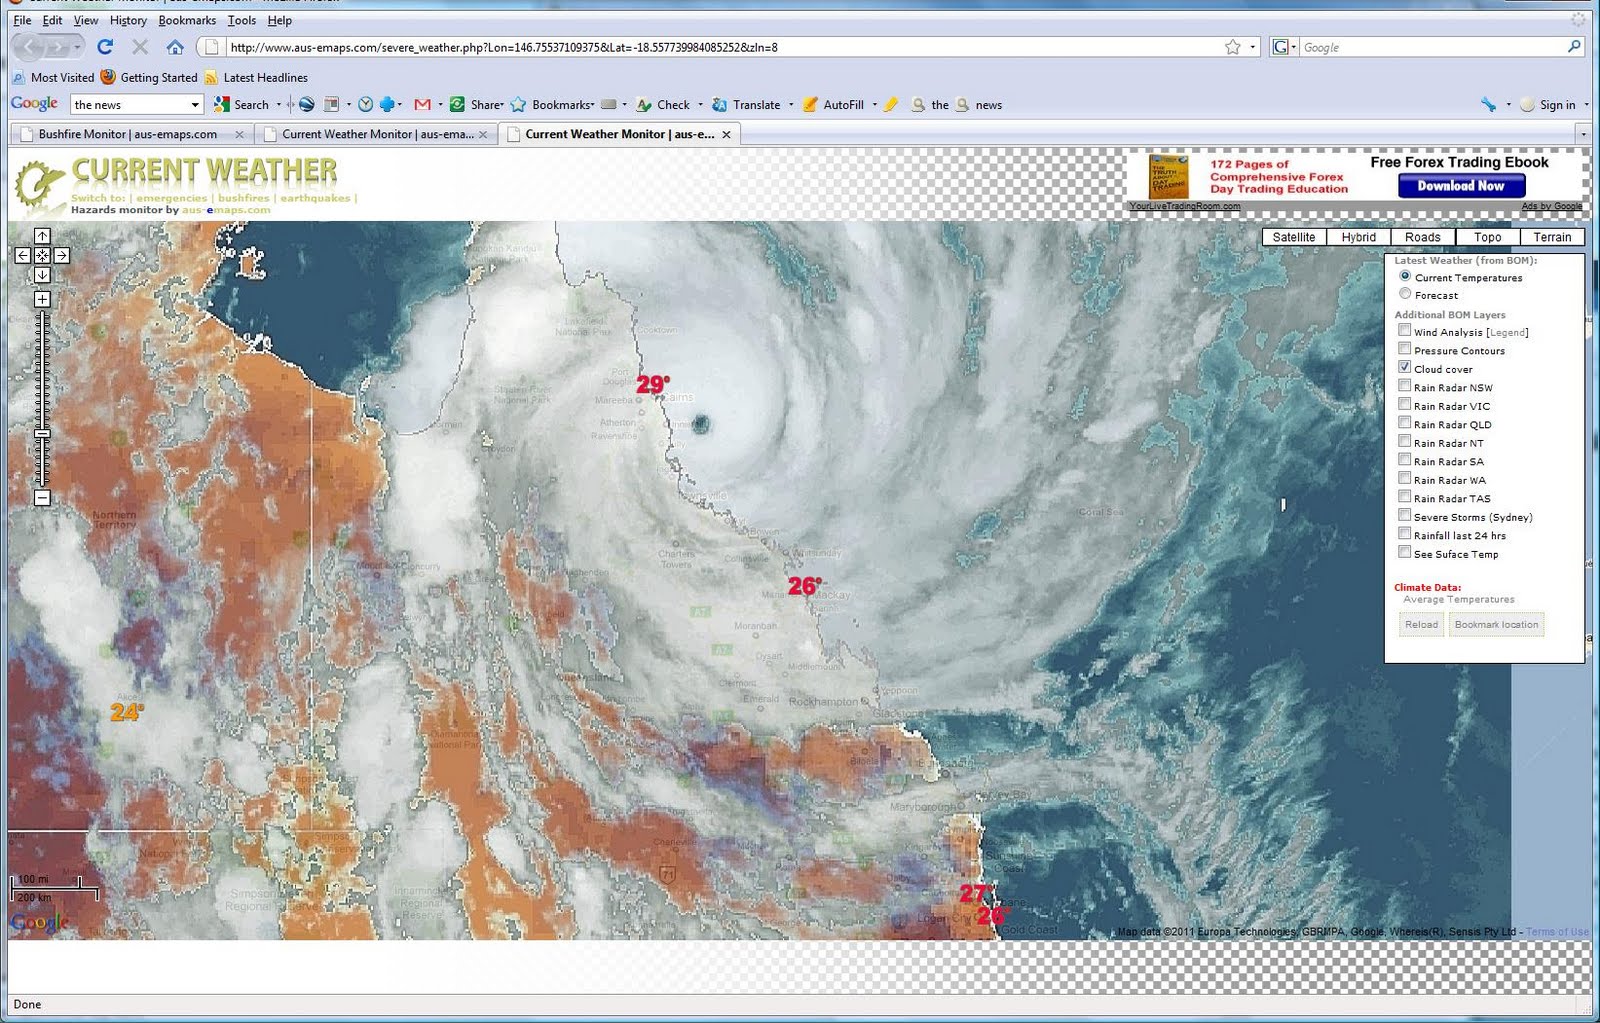
The latest satellite image of the approaching cyclone and wind speed information for the impact area can be monitored live on aus-emaps.com’s Hazards Monitor pages (courtesy of free Bureau of Meteorology web services):
 [turn on Clouds overlay to view the image, other layers are switched off]
[click wind icon in the top left corner of the map to add wind speed information layer and click/ move your mouse over the markers for details]
Updates:
[02/02/2011 at 8pm AEDT] Latest BOM update on tropical cyclone Yasi: just a crude “translation” of predicted path into kmz format for easy sharing on a map .
[03/02/2011] It is not totally over yet but media reports indicate there was no major disaster: no lives were lost and although there are many damaged houses and almost 190,000 people without electricity, overall impact of Cyclone Yasi will most likely not be as devastating as was initially anticipated. Below some pictures documenting the event, as captured by various aus-emaps.com tools.
 [Yasi crossing over to land – 3am AEDT]
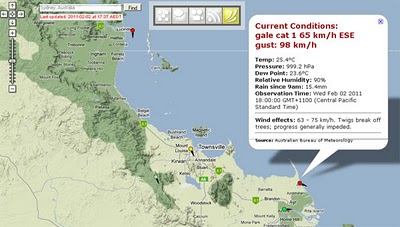
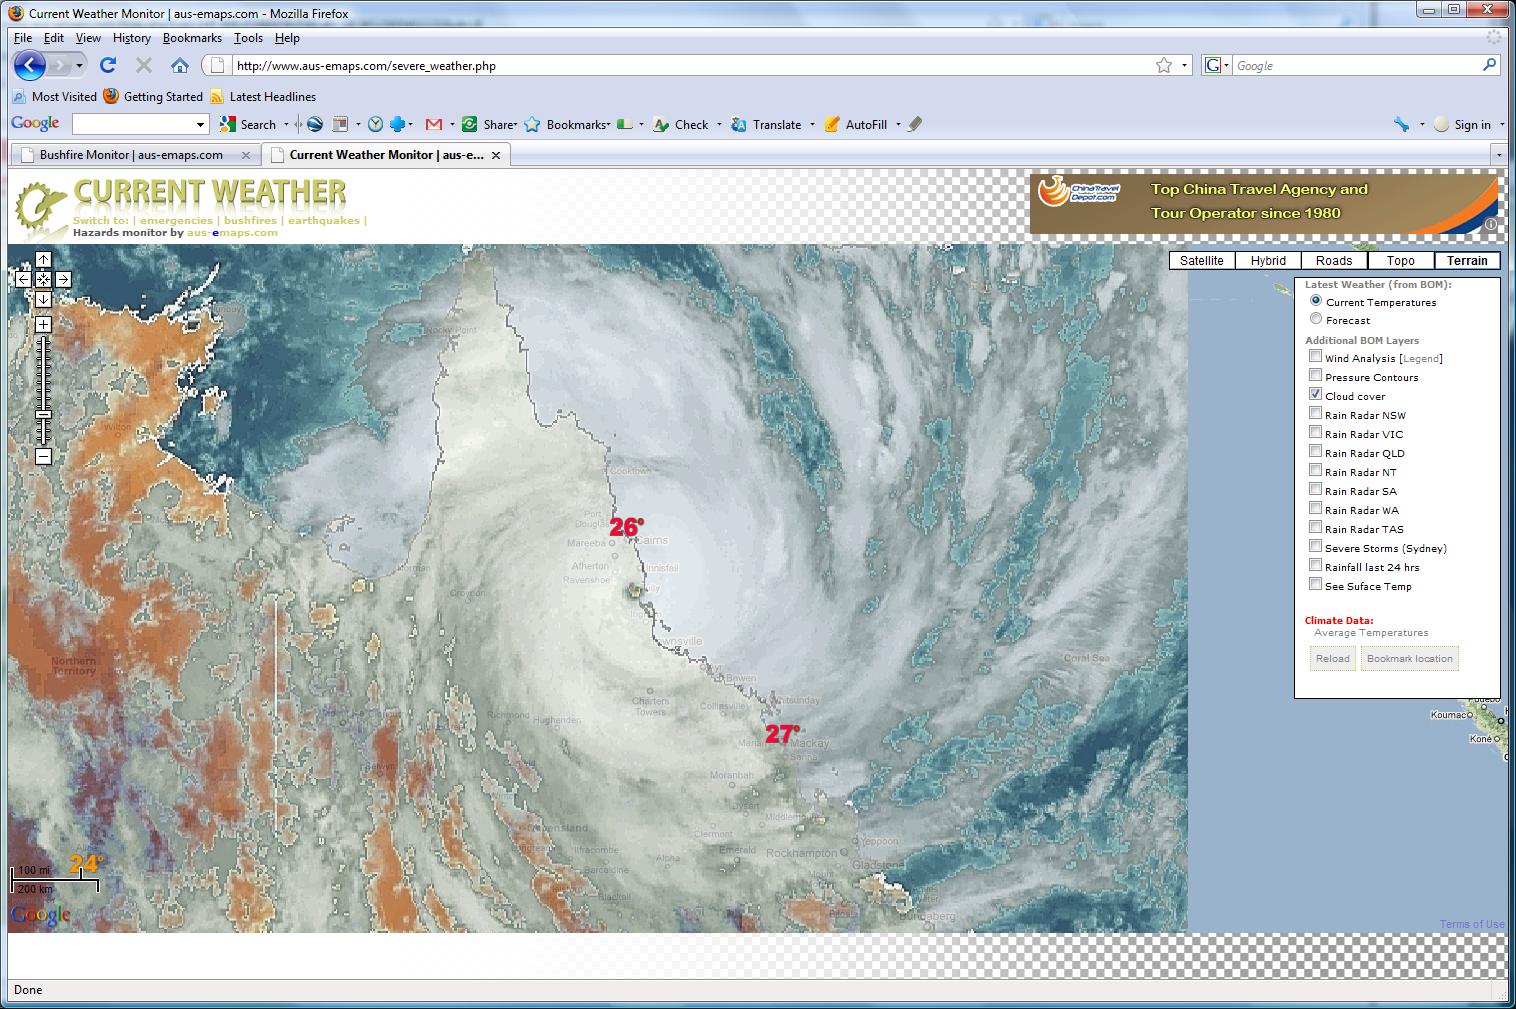
[Yasi location at 9pm AEDT on 02/02/20011]
 [Yasi location at 11pm 02/02/2011]
 [Yasi crossing over to land at about 3am AEDT 03/02/2011]
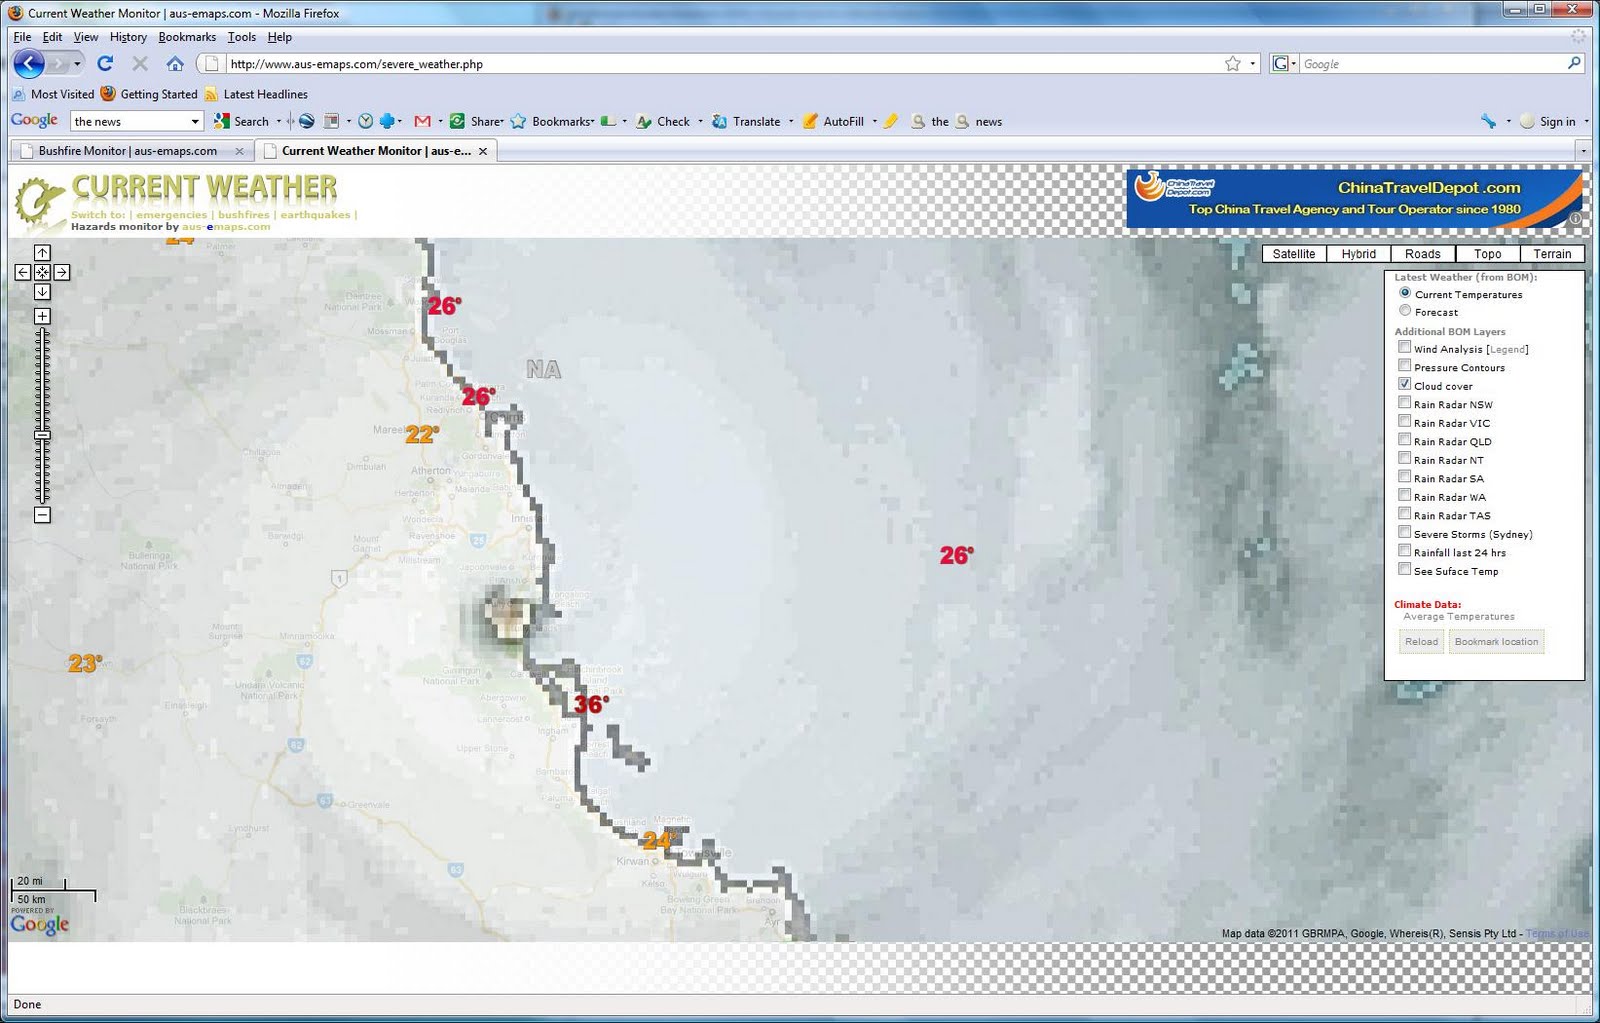
[Place of impact – very faint background but visible]
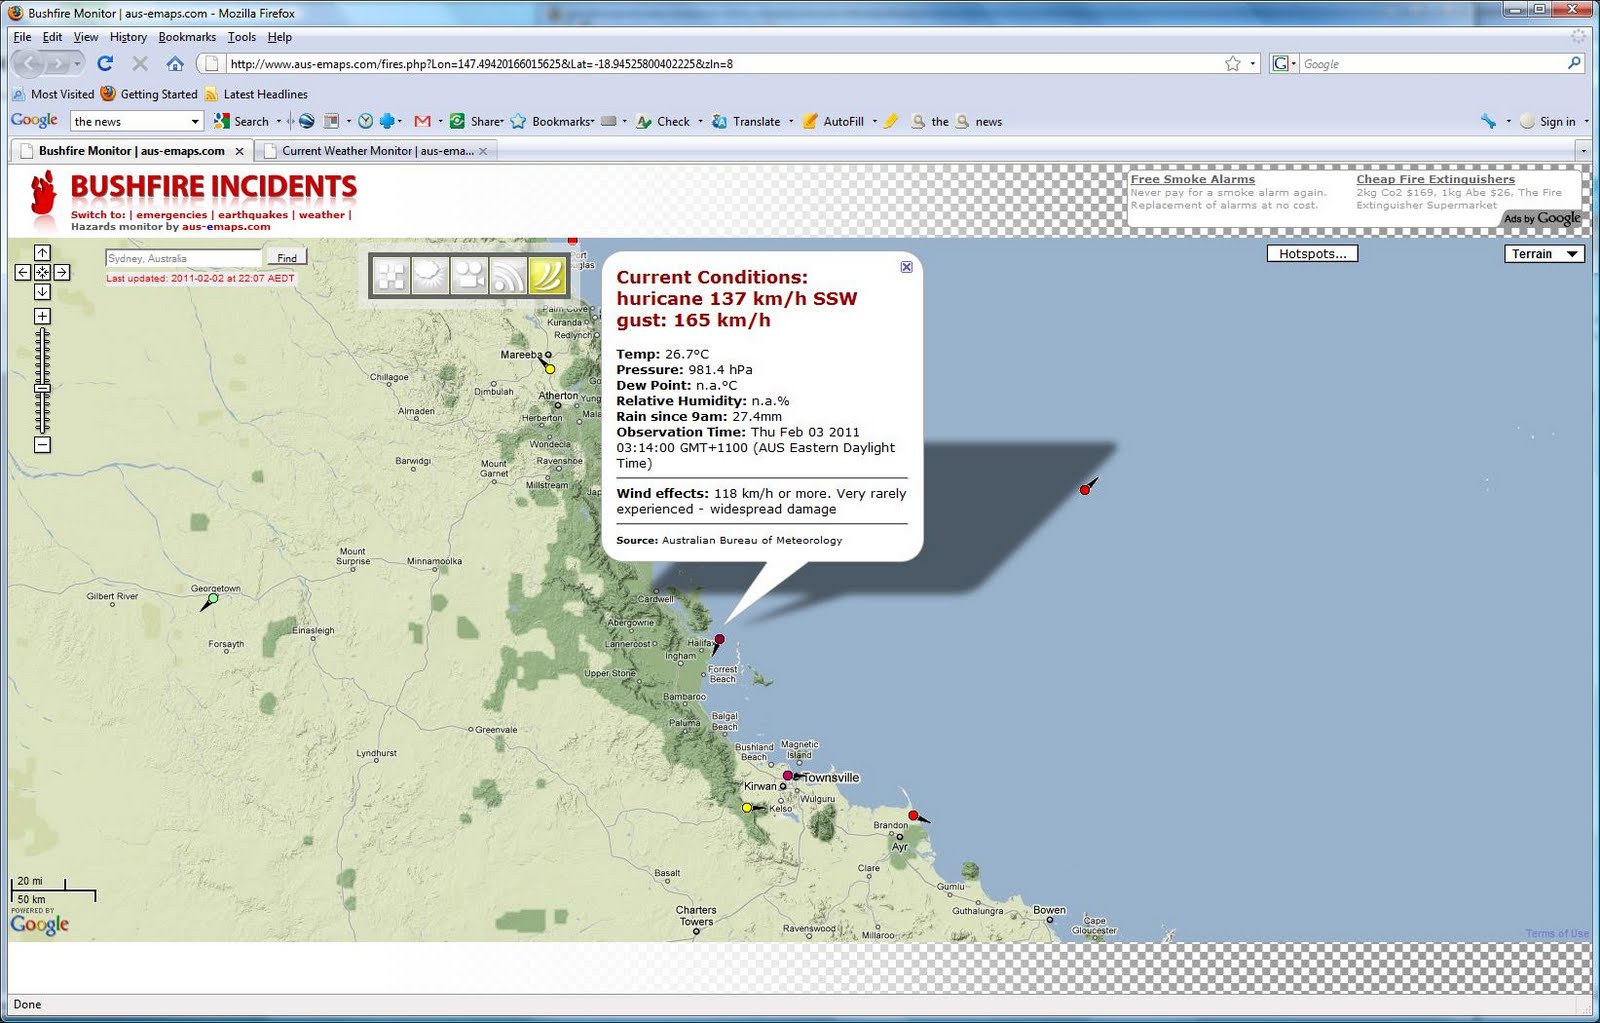
[Weather station reading near Halifax/ Ingham at the time of impact showing wind speed of 137 km/h and gusts up to 165 km/h – very high but half of what was anticipated and may explain why the damage to infrastructure was not so extensive.]