Google Fusion Tables is a modern data management and publishing web application that makes it easy to host, manage, collaborate on, visualize, and publish data tables online. Since we first launched Fusion Tables almost two years ago, we’ve seen tremendous interest and usage from dozens of areas, from journalists to scientists to open-data entrepreneurs, and have been excited to see the innovative applications that our users have been able to rapidly build and publish.
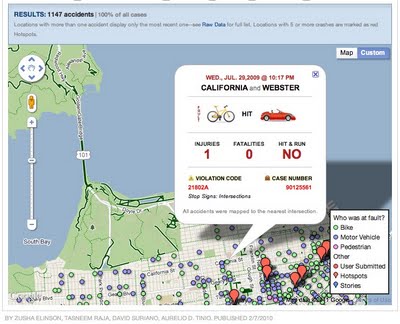
We’ve been working hard to enrich what Fusion Tables offers for customization and control of visual presentation. This past fall we added the ability to style the colors and icons of mapped data with a few clicks in the Fusion Tables web app. This spring we made it easy to use HTML and customize what users see in the info window that appears after a click on the map. We’ve enjoyed seeing the impressive visualizations you have created. Some, like the Guardian’s map of deprivation in the UK, were created strictly within the web app, while apps like the Bay Citizen’s Bike Accident tracker and the Texas Tribune’s Census 2010 interactive map take advantage of the Fusion Tables SQL API to do even more customization.

Of course, it’s not always convenient to do everything through a web interface, and today we’re delighted to invite trusted testers to try out the new Fusion Tables Styling and Info Window API. Now developers will be able to set a table’s map colors and info windows with code.
Even better, this new Styling and Info Window API will be part of the Google APIs Console. The Google APIs Console helps you manage projects and teams, provision access quotas, and view analytics and metrics on your API usage. It also offers sample code that supports the OAuth 2.0 client key management flow you need to build secure apps for your users.
So if you’ve been looking for a way to programmatically create highly-customizable map visualizations from data tables, check out our new APIs and let us know what you think! To become a trusted tester, please apply to join the Google Group and tell us a little bit about how you use the Fusion Tables API.
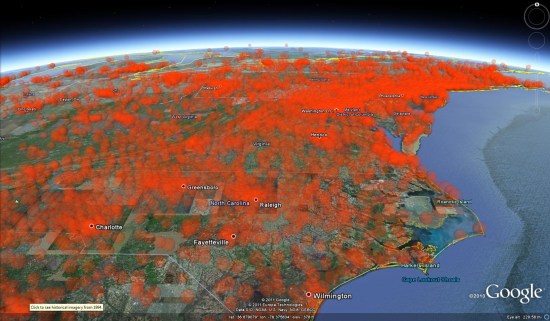
![]() uses transparent spheres with volumeric values, similar to the demos we have seen from DataAppeal in the past.
uses transparent spheres with volumeric values, similar to the demos we have seen from DataAppeal in the past.
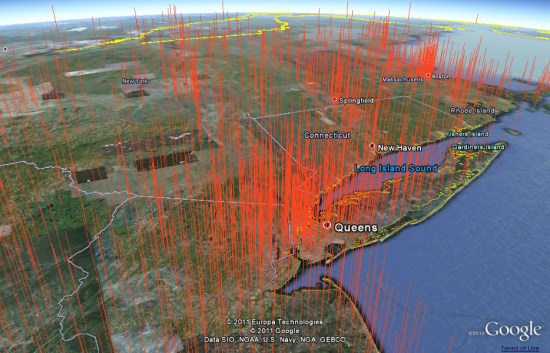
![]() shows the data with tall orange spikes, built using real data with dramatized height.
shows the data with tall orange spikes, built using real data with dramatized height.

