Discover Yours: Local recommendations powered by you and your friends

There’s something so exciting about discovering new places. Nothing beats finding a great new place I’ve never been—whether it’s a new bakery with a special dessert, a hole-in-the-wall Mediterranean place I didn’t notice before or a local art gallery where I can let my imagination roam free.

The challenge with finding those great places is that each of us has different tastes. I want to find places I like and I want to find them quickly. So when I’m overwhelmed with possibilities, I turn to sources I can trust. For example, if I’m in a new city, I might chat with the concierge at my hotel and explain to him the kinds of places I like so he can give me personalized recommendations, or I’ll ask my friends for local recommendations because I value their opinions and we have similar tastes. But finding trusted advice is hard; wouldn’t it be great if there was a way for me to get these recommendations all the time, everywhere I go?

We are trying to do exactly that, and today we’re excited to share the first step: an early release of Hotpot – a local recommendation engine powered by you and your friends. With Hotpot, we’re making local search results for places on Google more personal, relevant and trustworthy. There are three main ingredients in the Hotpot recipe:

  • Google Places – These are the 50 million places around the world for which we have rich details.
  • The places you like – When you rate places you like, we’ll tell you about other related places you’ll love. I love my favorite neighborhood restaurant in Noe Valley, Firefly, so when I rate it 5 stars, Hotpot will try to recommend other places for me in the city with simple, homey food such as Home restaurant.
  • The places your friends like – Share your ratings with your friends and see the places they’ve recommended. I’m planning a trip to Barcelona for the holidays and my friend Bernardo is a local. With Hotpot, I can see his recommendations when planning my trip on Google Maps, or when I’m in Spain using Google Maps or Places for Android.


Combining these three ingredients makes the hard task of choosing where to go easy; all you need is to rate places and add your friends. To do that we created the Hotpot rating app: quickly rate all the places you’ve been to and choose exactly which friends you want to invite to Hotpot. Then, when you’re visiting places, you can continue rating on the go from Mobile maps on Android.

Rate from the Hotpot rating app
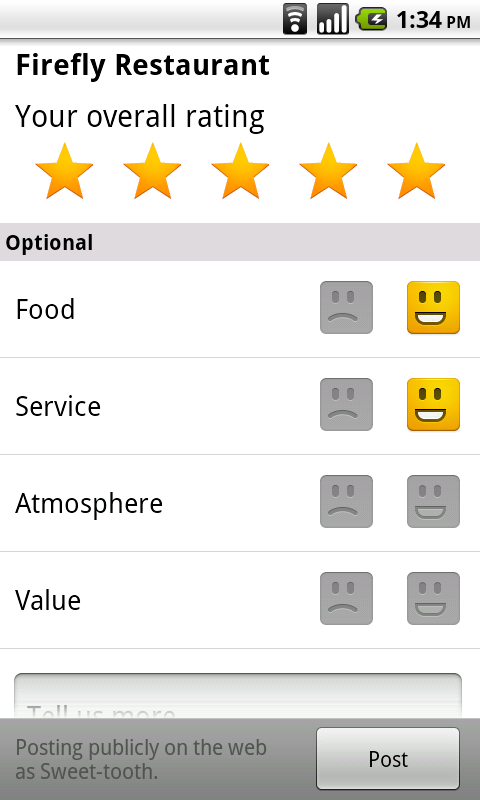
Rate from Mobile maps on Android

Your recommendations are with you whenever you need them. In search results, you can see recommended places by using the new Place Search and clicking on the “Places” filter. You can also see recommendations when searching on Google Maps, Google Maps for Android or when checking the Place pages for a specific business.

Recommendations on Place Search

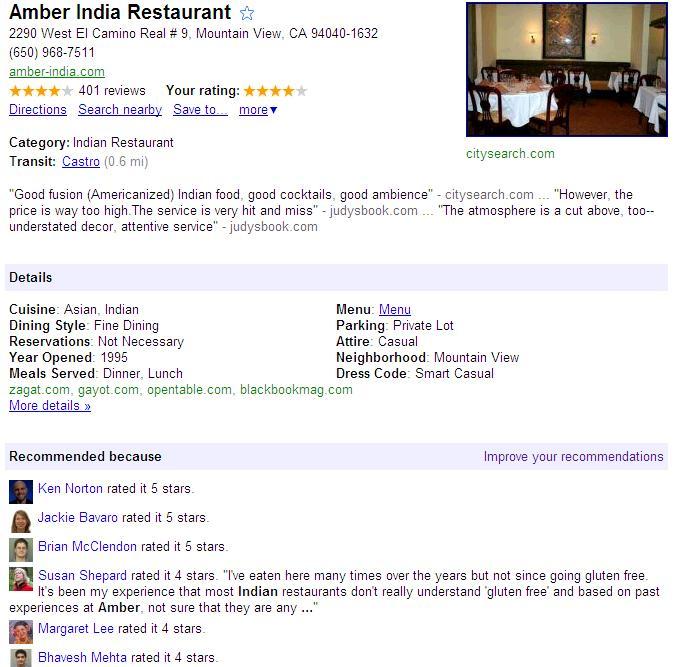
Recommendations on a Place page

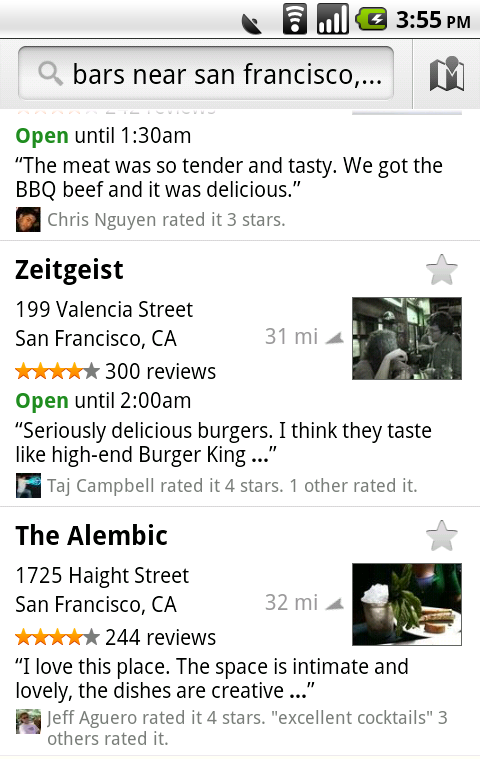
Recommendations on Google Maps for Android

You can set a Places nickname (here’s how) when you start using Hotpot, so you control how you post your ratings. That way, only your friends will be able to see your real name.

Happy hotpotting!

Google Developer Days: Meet the Google Geo Engineers

Posted by Mano Marks, Google Geo APIs Team

Google Developer Days 2008, a set of one-day developer events, are back and will take place in locations around the world. We’ve designed these events for developers with strong coding backgrounds, so that we can discuss our APIs, developer tools and applications.

We’ll host Google Developer Days in these locations:

  • Yokohama, Japan (June 10)
  • Beijing, China (June 12)
  • Taipei, Taiwan (June 14)
  • Sydney, Australia (June 18)
  • Mexico City, Mexico (June 23)
  • Sao Paulo, Brazil (June 27)
  • London, UK (Sept 16)
  • Paris, France (Sept 18)
  • Munich, Germany (Sept 23)
  • Madrid, Spain (Sept 25)
  • Milan, Italy (Oct 21)
  • Prague, Czech (Oct 23)
  • Moscow, Russia (Oct 28)

If you’re based in the US, we encourage you to come to Google I/O, on May 28-29 in San Francisco.

At Google Developer Day, our Maps and KML engineers will share their inside knowledge on our developer tools and APIs, including the Google Maps API and KML. In many locations we’ll do deep dives into code and conduct hands-on codelabs. If you come to Yokohama and Mexico City, say hi to me and Pamela Fox.

We’ve posted detailed information for our early dates and will be adding more information for other locations soon. If you’re a developer, we encourage you to sign-up for a Google Developer Day at a nearby location. I hope to see you there.

Global Warming Map – Review ptI

This is the first half of a two part review.
I did a skim review last month of the Foreign office’s recent Google Earth project showing the effect of 4 degrees average temperature rise. In short, its a great topic to work with but they could have done much better in terms of geoweb usability.

Background
The project was originally produced as a 2D map which has been transferred to a Google Earth plugin and GEarth file presentation with more data. Click on the image to get to the original

I’ll be reviewing the presentation in the GEarth plugin (visible on the main page) and the theGEarth file which is linked to from the main page.

I’ve been in contact with the Kirsty Lewis the project manager (I’m not certain of her exact role) who’s commented on a draft of this review.

Press: Its got a lot of press attention e.g. this piece on channel 4 news.

Review Pros

Icons: The ‘Impacts’ icons (round and multi-colored) are clear, clean and use good symbols so the user can guess what they represent before actually clicking them. I like the use of color as well, by choosing less intense colors they’ve allow differentiation between impact layers without being overpowering.

Topic: Climate change is a global problem so Google Earth represents a good choice of medium. I especially like the overarching approach they’ve taken: ‘what will be the effect of a 4 degree rise in global average temperature’, because certainly here in the UK with our damp, cold winters a 4 degree rise in average temperature seems attractive if you think of it only in a shallow manner.

Acronyms and Jargon: Throughout the project both videos and maps, they steer clear of science acronyms and jargon which is good to see in a science communication project.

Review Cons
Use Points not Areas: The project marks areas with a colored ring and provides an icon of the same color nearby that can be clicked for more information. Thus we click a tap icon to find out that droughts in southern Europe are becoming more common. It would be better to give specific examples of droughts at several points as you could have then involved photos and a human scale story of the global problem. E.g. show a photo of a Farmer in Spain with dry soil running through his fingers and a personal story about how his farm is being affected.
Kirsty commented that she thought that this ‘specific location’ approach would lead to users incorrectly thinking that climate change is completely to blame for specific problems and that explaining the concepts would be complex and unwieldy. I see her point with this, climate change is often one of a number of factors producing a problem such as arid farms and climate change actually affects the probability of drought in a given area, it’s incorrect to say it produces droughts. However, I think you could add caveats that would work around these issues without overloading the content – I explain the issues to 14 year old students in 5 minutes using a betting analogy.

Multiple Areas at the same time: Another problem with the area approach is that its confusing to show multiple overlapping areas at the same time as can be seen in this screen shot of the GEarth plugin version:


There are multiple solutions to this confusing view, e.g. annotate areas with a color fill and white border and allow only one layer at a time to be viewed, I’ve produced a mock up below:

of course, it’s easier still to use points instead of areas as I recommend above.

Kirsty’s answer to this is that the circles make the point that areas are overlapping. That’s a fair point but you need to make it less visually complex when first viewed by a user. The circles would work better if they were introduced added one by one in a GEarth tour with an audio narrative (a concept I explore in in a book chapter).
She also thinks that its important that the GEarth presentation is visually similar to the original map so people understand the links between the projects and that removing the circles would severe that link. I think she’s correct that branding is important but that doesn’t mean you have to re-use all the details – just keeping the icons set is enough to link the GEarth and Map presentations in the user’s mind.
second half next week…