Heading for the slopes this winter? Put on your warm hat, grab your mittens, rent those skis, and bundle up in your warmest jacket … and don’t forget your GPS tracking device! When you hit the slopes this winter, track your route down the slopes and share your animated ski tracks in Google Earth.
This past weekend, a couple of Googlers and I headed up to Lake Tahoe, CA with a few GPS devices. We recorded some of our favorite ski runs and animated our tracks in Google Earth. You can check out all of our animated tracks in the video below, or download the KML to play the tracks in Google Earth.
Capturing a GPS track is easy — just make sure that you have a GPS tracking device on hand before you hit the slopes. A Garmin® or Magellan® device works best, but you can also use a GPS tracking application on most mobile phones. My Tracks on Android works well, or if you have an iPhone, try using MotionX-GPS.
When you get to the top of the mountain, start recording your track. Place your phone or device in an outside pocket, preferably separate from another device. When you get to the end of your run, stop the track. Or, if you prefer to track the entire day, keep the GPS track running. Most of us decided to keep our tracks running the entire day so we could focus entirely at the task at hand – skiing.
After a full day of skiing and snowboarding, we grabbed some hot cocoa from the lodge and headed home, where we imported our tracks into Google Earth. My fellow Googler, David captured his GPS data with My Tracks, and imported the data by dragging and dropping a .gpx file into Google Earth. We then started playing with the new GPS track animation feature launched in Google Earth 5.2, and customized and animated our ski tracks just the way we wanted them. Take a look below at how David customized the line color and label of his track. (He even personalized the tracking icon to make it look like an actual skier!)
We also animated our tracks by creating a tour, which we customized by changing the camera tilt angle, camera range, and tour speed in the preferences dialog. Here’s a helpful hint: if you want it to seem like you went faster, create a tour with a high speed setting to view your track in fast-forward.
Next, we used Google Earth’s Elevation Profile feature to get a better idea as to the difficulty of the runs we skied that day. With GPS tracks, the feature can show both an elevation profile (shown below in red), and a speed profile (shown below in blue). Looking at the red elevation profile below, as you ski around the mountain, there is quite a bit of elevation change. We then counted the total number of peaks in our track’s elevation profile to discover how many runs we skied in one day.
Don’t ski or snowboard? Don’t worry! You can track other exciting winter activities in Google Earth. I’ve never been a big skier, but I love to snowshoe and go dog sledding. Check out the dog sledding tour I created below, paired with a photo of my actual dog sledding experience.
We had so much fun tracking our winter adventures in Tahoe that we even tracked our bus ride home to San Francisco. We were sorry to leave, but I knew we’d be back to trace new paths in the mountains next year — or even next weekend!
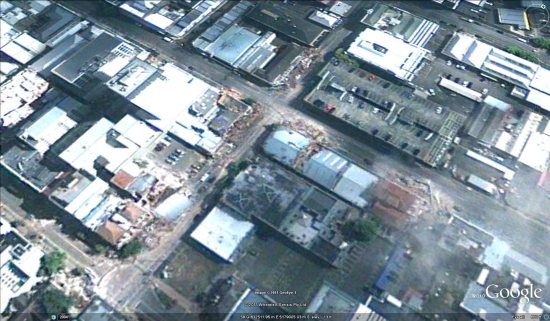
 Modeling Progress: On the left are geo-models that existed before the Google workshops. On the right are models currently visible in Google Earth.
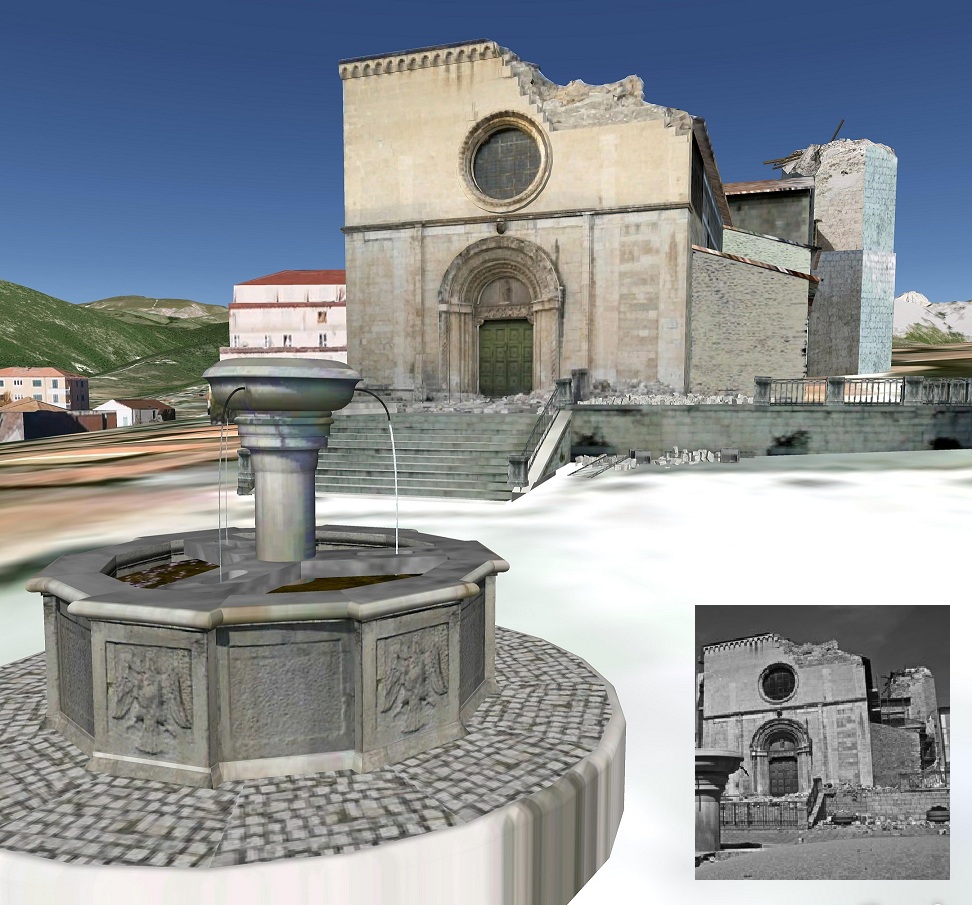 SketchUp model and picture (inset) of the S. Pietro di Coppito (XIII century) after the earthquake.
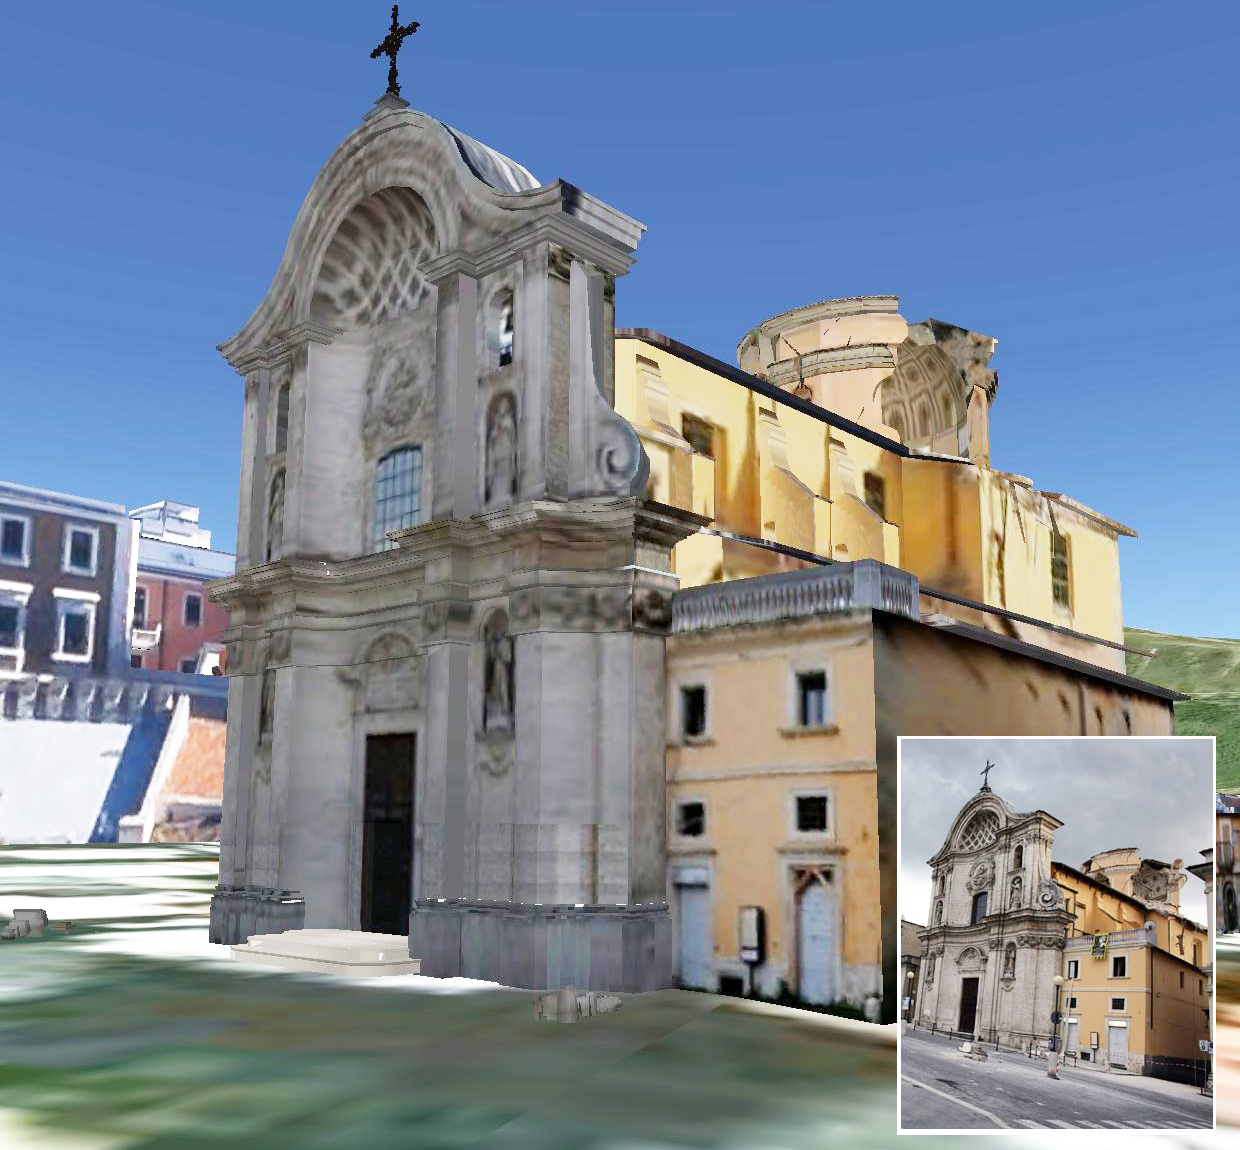 SketchUp model and picture (inset) of Santa Maria del Suffragio (XVIII century) after the earthquake.