The Globalization of Social Search

In 2009 we first introduced Social Search on google.com as an experimental feature designed to help you find more relevant information from your friends and the people you care about. Since then we’ve been making steady improvements to connect you with more people and more relevant web results. Today, we’re bringing Social Search to more users around the globe.

Just like on google.com, social search results in other languages and on other domains are mixed throughout the Google results page based on their relevance. For example, if you’re looking for information about low-light photography and your friend Marcin has written a blog post about it, that post may show up higher in your results with a clear annotation and picture of Marcin:

Social search results can rank anywhere on the page, and you’ll see who shared the result in the annotation underneath.


Social Search can help you find pages your friends have created, and it can also help you find links your contacts have shared on Twitter and other sites. If someone you’re connected to has publicly shared a link, we may show that link in your results with a clear annotation. So, if you’re looking for information about modern cooking and your colleague Adam shared a link about Modernist Cuisine, you’ll see an annotation and picture of Adam under the result. That way when you see Adam in the office, you’ll know he might be a good person to ask about his favorite modern cooking techniques.

Social Search includes links people share on Twitter and other services.

So how does this all work? Social search results are only visible to you and only appear when you choose to log in to your Google Account. If you’re signed in, Google makes a best guess about whose public content you may want to see in your results, including people from your Google chat buddy list, your Google Contacts, the people you’re following in Google Reader and Buzz, and the networks you’ve linked from your Google profile or Google Account. For public networks like Twitter, Google finds your friends and sees who they’re publicly connected to as well. You can see a complete list of the people included in your social search results in your personal Google Dashboard (this display is private). For an overview of Google Social Search, check out the explanatory video:

Social Search is rolling out globally in 19 languages and should be available in the coming week, with more languages on the way. People around the world will find similar types of social results as people in the U.S., and we plan to introduce the +1 feature as soon as we can. With these changes, we want to help you find the most relevant information from the people who matter to you.

The QRator – iPad and Web Based Living Labels for Museums

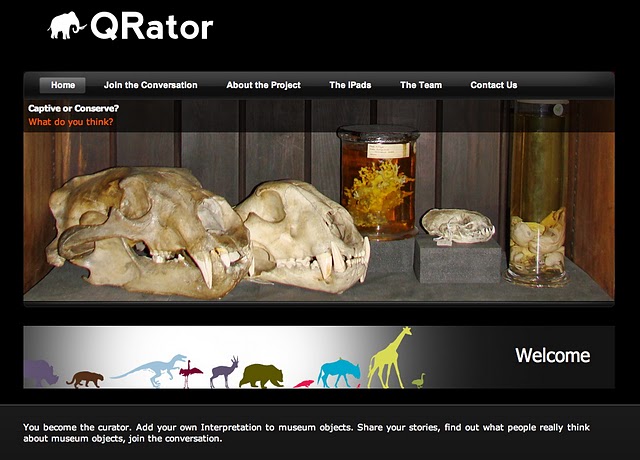
QRator is a collaborative project between the UCL Centre for Digital Humanities (UCLDH), UCL Centre for Advanced Spatial Analysis (CASA), and UCL Museums and Collections, to develop new kinds of content, co-curated by the public, museum curators, and academic researchers, to enhance museum interpretation, community engagement and establish new connections to museum exhibit content.

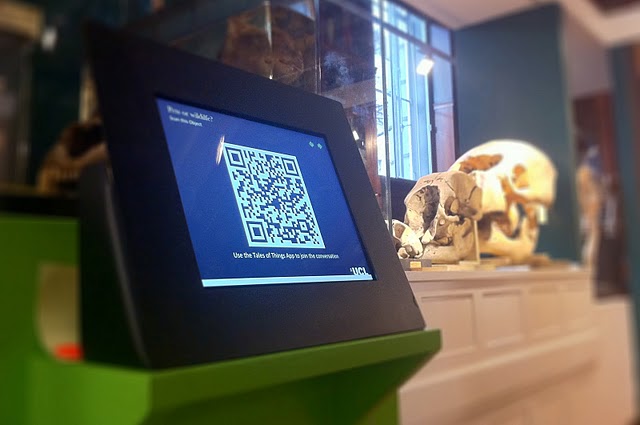
The interactive system is designed to be non intrusive while enabling members of the pubic to simply type in their thoughts and interpretation of museum objects and click ‘send’. Their interpretation become part of the objects history and ultimately the display itself via the interactive label system to allow the display of comments and information directly next to the artefacts.

The project is powered by Tales of Things technology which has developed a method for cataloguing physical objects online and capture memories and stories via the Internet of Things. QRator takes the technology a step further bringing the opportunity to move the discussion of objects direct to the museum label and onto a digital collaborative interpretation label, users’ mobile phones, and online allowing the creation of a sustainable, world-leading model for two-way public interaction in museum spaces.


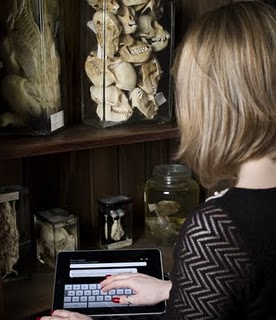
At its heart QRator is an iPad/iPhone and web based system that allows everyone to be a curator and share their views on an exhibition. Visitors can examine an object before leaving their thoughts via an iPad to create a digital, ‘living’ label that subsequent visitors can read and respond to.


By downloading a free application to an iPhone or android phone, visitors are able to see rolling updates to the digital label after they leave the museum, or via twitter. Participants are also able to take part in the conversation online via the QRator site with comments appearing live within the museum.

Content currently covers two museums at UCL; The Grant Museum of Zoology and The Petrie Museum of Egyptology. he Grant Museum of Zoology is one of the oldest natural history collections in England, dating back to 1827. The collection comprises over 68,000 skeletal, taxidermy and wet specimens, covering the whole of the animal kingdom. Many of the species are now endangered or extinct including the Tasmanian tiger or thylacine, the quagga and the dodo. The Grant Museum is the only remaining university zoology museum in London.

The Museum will offer a continual programme of ‘Current Questions’ for visitors to engage in. UCL is taking the opportunity to rethink what a university museum can be; a place not simply for a passive experience but for conversation – a cultural laboratory for the meeting of minds. Positioning the Museum as a place of experimentation, dialogue and debate.

Open Street Map Road Types For Display and Routefinding

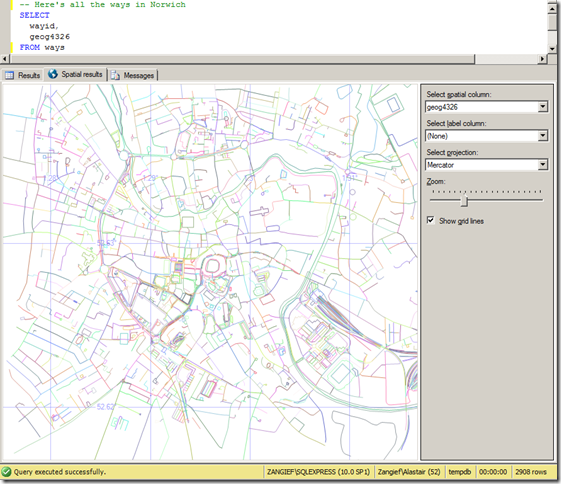
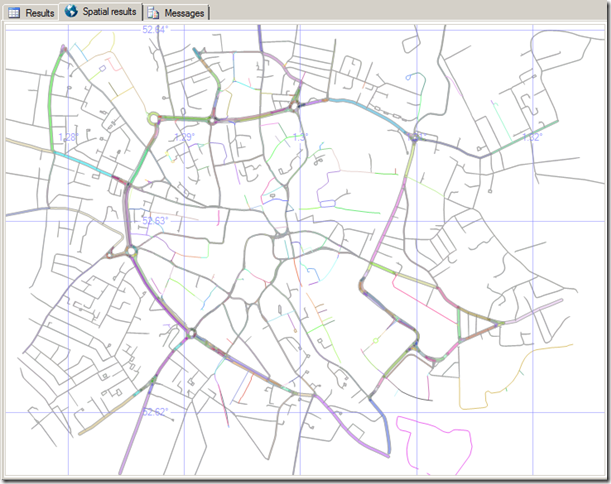
We displayed a set of ways imported from Open Street Map in SQL Server Management Studio. It looked like this:

image_thumb1

Now, as I stated previously, OSM ways don’t equate to roads. Ways can be any arbitrary series of nodes, so although at first glance it may appear to be so, the map above does not represent a roadmap. A single way may represent several roads, or only a single segment of one road. Many ways are nothing to do with roads at all – they may be rivers, or railway lines. Ways may also denote the boundaries of an area, such as a county, a park, or a building.

To create a dataset of OSM roads (or footpaths, tracks etc.) suitable for routefinding or display in a road map, it is necessary to retrieve only those ways that contain a tag element with a k attribute of “highway”. The corresponding v attribute describes the type of highway. Examples of possible values include:

  • cycleway
  • footway
  • motorway
  • path
  • pedestrian
  • primary
  • residential
  • road
  • secondary
  • service
  • steps
  • tertiary
  • track
  • unclassified

Note that this list isn’t exhaustive – the design of the OSM schema means that editors can tag ways or nodes with any values, but this is a list of some of the commonly-used tags.

There are many reasons why you might want to categorise each of these highway types separately.

  • Consider access for different modes of transport, for example; clearly, a car can’t go down a cycleway. Nor can a tractor go on a motorway, or a cycle go down steps (unless you’re planning some sort of stunt bike ride).
  • If you’re designing a route-finding application, you might want to consider and compare the relative costs of travelling down different routes. Motorway segments generally have a higher speed limit than primary roads, which in turn have higher average speed than secondary roads, etc. Therefore, a route that maximises the percentage travelled on higher-status roads may well be shorter in time, even if it covers a longer distance.
  • When drawing features onto a map, it’s usual to display different categories of highways with different styles (e.g. motorways coloured blue, primary roads thicker than secondary, tracks as dotted/dashed lines).

As a simple example, to style the Spatial Results tab view of my OSM map to show different categories of roads with different thicknesses I created a table to attach a weight to each highway type, as follows:


CREATE TABLE RoadWeights (
highwaytype varchar(32),
roadweight int
);
INSERT INTO RoadWeights VALUES
(‘motorway’, 15),
(‘motorway_Link’, 15),
(‘trunk’, 10),
(‘trunk_Link’, 10),
(‘primary’, 8),
(‘primary_Link’, 8),
(‘secondary’, 5),
(‘tertiary’, 3),
(‘residential’, 1),
(‘unclassified’, 0);

Then, I edited my SELECT query to only display rows from my Ways table that were tagged with one of my chosen highway types, and buffered the geography LineString representing each road by the corresponding weight from the RoadWeights table:

SELECT
w.wayid,
wt.TagValue AS highwaytype,
w.geog4326.STBuffer(ISNULL(roadweight,0))
FROM
ways w
INNER JOIN waytags wt ON w.wayid = wt.wayid AND wt.TagName = ‘Highway’
LEFT JOIN RoadWeights rw ON wt.TagValue = rw.highwaytype
WHERE
wt.TagValue IN (‘motorway’, ‘motorway_Link’, ‘trunk’, ‘trunk_Link’, ‘primary’, ‘primary_Link’, ‘secondary’, ‘tertiary’, ‘residential’, ‘unclassified’)

Even when viewed in the SSMS Spatial Results tab, the map already becomes much cleaner than the result shown at the top of this post – with the Norwich inner ring road and its primary arterial roads now clearly visible (and also, the train tracks coming into the railway station on the south east of the city are no longer shown)

Clearly you wouldn’t normally optimise your dataset just for the purposes of display in the SSMS spatial results tab, but you can apply this same technique to attach any other properties that correspond to the type of road – the average road speed limit, accessibility, or styling options that should be passed to a front-end display, for example.