Google Maps: The power of Fusion Tables with Dynamic Styling

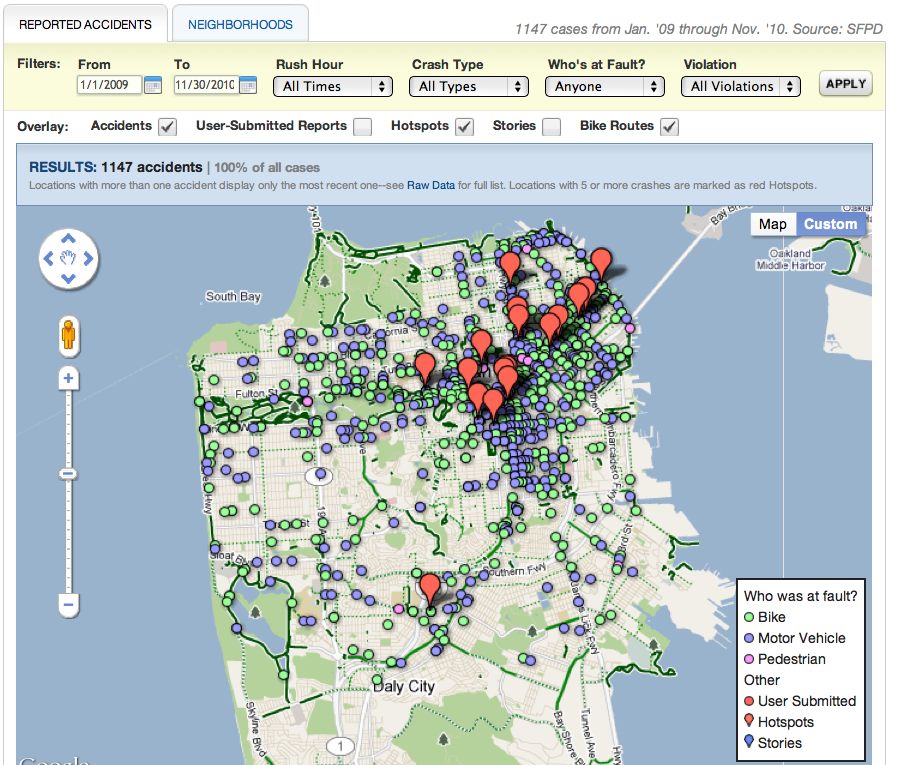
The Fusion Tables Layer has been one of the most successful new features launched in the Maps API in the last year. We have seen a wealth of fascinating data visualizations that rely on Fusion Tables, such as the Bay Citizen Bike Accident Tracker and the WNYC Police Precinct map.

At Google I/O this week, Simon Rogers of the Guardian joined me and Kathryn Hurley of the Geo Developer Relations team to present some examples of how the Guardian uses Fusion Tables to visualise data for their readers, and introduce some great new features:

Fusion Tables allows you to share large tables of spatial data and render them on a map in a way that performs consistently well across all browsers, on desktop and mobile. The way in which the data is styled on the map, the markers used for points, the colours and stroke widths used for polylines and polygons, can be defined by the owner of the table in the Fusion Tables application, or using the new Fusion Tables Styling and InfoWindows API. However only the owner of the table can define the styling in this way, and styling for any single table is fixed.


At Google I/O we introduced Dynamic Styling of Fusion Tables layers. This allows the styling rules used for displaying a table in a Maps API application to be defined from JavaScript, and changed dynamically. For example you can use this to switch between rendering different data sets in the same table, or giving users control over which subset of the data is highlighted, as in the below example based on a public table of Chicago Homicides data:


In order to ensure the continued reliability of the Fusion Tables layer, we are also introducing some limits on the number of layers that can be used, and the complexity of styling. The Maps API now permits up to five Fusion Tables layers to be added to a map, one of which can be styled with up to five styling rules.

For information and code samples of how to apply dynamic styling to Fusion Tables, see our documentation, and for further assistance I recommend the Google Maps JavaScript API V3 forum. It’s great to see the creative ways in which Fusion Tables Layer is being used, and we hope this new flexibility will drive even more inspiring and informative Maps API applications.

Beautiful & interactive maps faster with the Fusion Tables API

Google Fusion Tables is a modern data management and publishing web application that makes it easy to host, manage, collaborate on, visualize, and publish data tables online. Since we first launched Fusion Tables almost two years ago, we’ve seen tremendous interest and usage from dozens of areas, from journalists to scientists to open-data entrepreneurs, and have been excited to see the innovative applications that our users have been able to rapidly build and publish.

We’ve been working hard to enrich what Fusion Tables offers for customization and control of visual presentation. This past fall we added the ability to style the colors and icons of mapped data with a few clicks in the Fusion Tables web app. This spring we made it easy to use HTML and customize what users see in the info window that appears after a click on the map. We’ve enjoyed seeing the impressive visualizations you have created. Some, like the Guardian’s map of deprivation in the UK, were created strictly within the web app, while apps like the Bay Citizen’s Bike Accident tracker and the Texas Tribune’s Census 2010 interactive map take advantage of the Fusion Tables SQL API to do even more customization.


Of course, it’s not always convenient to do everything through a web interface, and today we’re delighted to invite trusted testers to try out the new Fusion Tables Styling and Info Window API. Now developers will be able to set a table’s map colors and info windows with code.

Even better, this new Styling and Info Window API will be part of the Google APIs Console. The Google APIs Console helps you manage projects and teams, provision access quotas, and view analytics and metrics on your API usage. It also offers sample code that supports the OAuth 2.0 client key management flow you need to build secure apps for your users.

So if you’ve been looking for a way to programmatically create highly-customizable map visualizations from data tables, check out our new APIs and let us know what you think! To become a trusted tester, please apply to join the Google Group and tell us a little bit about how you use the Fusion Tables API.

Public data visualization with Google Maps and Fusion Tables

The Bay Citizen is a nonprofit, nonpartisan news organization dedicated to fact-based, independent reporting of issues in the San Francisco Bay Area. We are interested in visualizing public data that is useful to the local community. One such effort is our Bike Accident Tracker. In this post, I’ll present a simple example of how we used Google Maps and Google Fusion Tables to accomplish this.

This is what our accident map looks like:

Want to add our accident map to your site? Here is the code:

[php]<html style=’height: 100%’>
<head>
<script type=’text/javascript’ src=’http://maps.google.com/maps/api/js?sensor=false’></script>
<script type=’text/javascript’>
function initialize() {
var bc_office = new google.maps.LatLng(37.788901, -122.403806);
var map = new google.maps.Map(document.getElementById(‘accident-map’), {
center: bc_office,
zoom: 13,
mapTypeId: google.maps.MapTypeId.ROADMAP
});
var accidents_layer = new google.maps.FusionTablesLayer(433634);
accidents_layer.setMap(map);
}
</script>
</head>
<body onload=’initialize()’ style=’height: 100%; margin: 0px; padding: 0px’>
<div id="accident-map" style=’height: 100%’></div>
</body>
</html>[/php]

That’s it. To test this yourself, just save the raw file, open the file with a browser and you will have a copy of the accidents map running locally on your computer. The code mainly deals with setting up Google Maps, with one critical line that sets up Fusion Table integration:

[php]var accidents_layer = new google.maps.FusionTablesLayer(433634);[/php]

You can expand this integration by filtering the results through the use of Fusion Tables’ sql-like query syntax. As an example, to display accidents from May 2009, change the line above to look like this:

[php]var accidents_layer = new google.maps.FusionTablesLayer(433634, {
query: ‘SELECT FullAddress FROM 433634 WHERE Year=2009 AND Month=5’
});[/php]

A quick gotcha to point out here is that Google Maps v3 only supports a SELECT operation on the location value column. So the location query above works just fine, but the COUNT query needed to get the number of accidents does not work:

[php]’SELECT COUNT() FROM 433634 WHERE Year=2009 AND Month=5′[/php]

Instead, to get the number of accidents in this case, you can use the Fusion Tables API endpoint directly:

[php]https://www.google.com/fusiontables/api/query?sql=SELECT COUNT() FROM 433634 WHERE Year=2009 AND Month=5[/php]

You can see the actual response from the count query here. Because The Bay Citizen is built on the Django framework, we can leverage the Python libraries Google provides for query generation and API calls. Also, since the location query is so similar to the count query, I consolidated the filter logic so it happens on the server side using a jQuery AJAX call. As a result, when users apply a filter, they see an updated map and results bar all thanks to the following few JavaScript lines:

[php]$(‘#filter-form’).ajaxForm({
success: function(responseText, statusText) {
var data = $.parseJSON(responseText);
accidents_layer.setMap(null);
accidents_layer = new google.maps.FusionTablesLayer(433634, {
query: data.map_query});
accidents_layer.setMap(map);
$(‘#filter-results’).html(data.results);
}
});[/php]

I was really happy with this approach. The performance hit is negligible, the code is much cleaner, and the filter logic is rewritten in the programming language I currently know best (Python).

I hope this post gives you a taste of what it’s like to work with Google Maps and Fusion Tables. Also, please note that our data is public and can be referenced at Table #433634. This means you’re free to use the same data we do to develop and design your own map interface. When we update the data, your project will be updated as well.

From our end, we don’t have to worry about our servers being overloaded with data API and map generation calls that come from your project. So by all means, hack away, improve the design, and create a better version. All we ask is that if you do come up with something cool, please link back to us, let us know, and then maybe we can even work together.