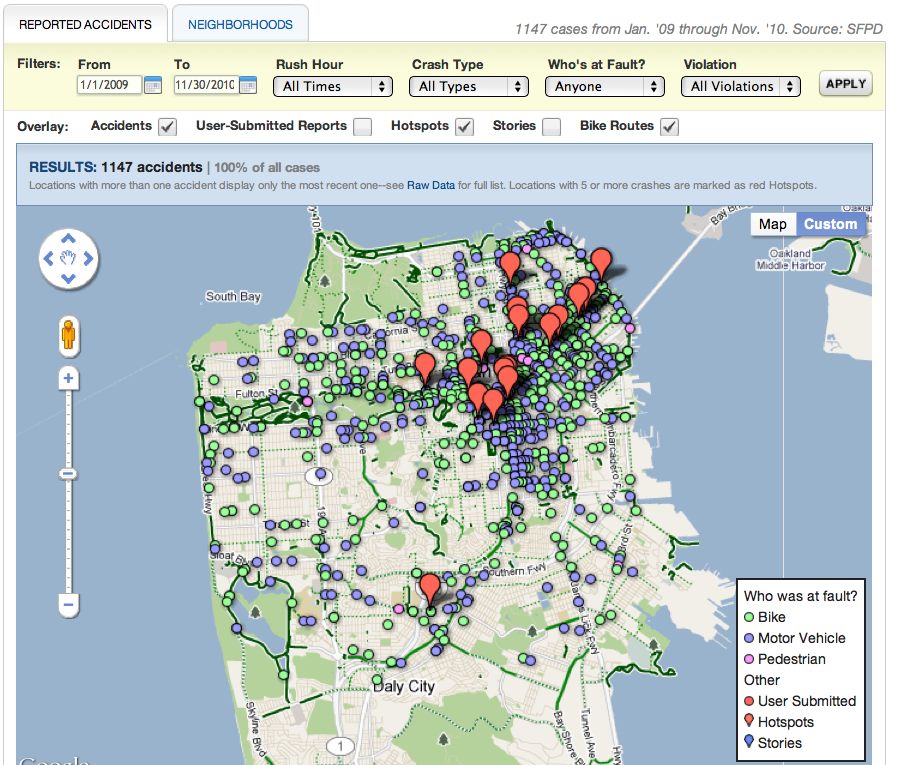
The Bay Citizen is a nonprofit, nonpartisan news organization dedicated to fact-based, independent reporting of issues in the San Francisco Bay Area. We are interested in visualizing public data that is useful to the local community. One such effort is our Bike Accident Tracker. In this post, I’ll present a simple example of how we used Google Maps and Google Fusion Tables to accomplish this.
This is what our accident map looks like:
Want to add our accident map to your site? Here is the code:
[php]<html style=’height: 100%’>
<head>
<script type=’text/javascript’ src=’http://maps.google.com/maps/api/js?sensor=false’></script>
<script type=’text/javascript’>
function initialize() {
var bc_office = new google.maps.LatLng(37.788901, -122.403806);
var map = new google.maps.Map(document.getElementById(‘accident-map’), {
center: bc_office,
zoom: 13,
mapTypeId: google.maps.MapTypeId.ROADMAP
});
var accidents_layer = new google.maps.FusionTablesLayer(433634);
accidents_layer.setMap(map);
}
</script>
</head>
<body onload=’initialize()’ style=’height: 100%; margin: 0px; padding: 0px’>
<div id="accident-map" style=’height: 100%’></div>
</body>
</html>[/php]
That’s it. To test this yourself, just save the raw file, open the file with a browser and you will have a copy of the accidents map running locally on your computer. The code mainly deals with setting up Google Maps, with one critical line that sets up Fusion Table integration:
[php]var accidents_layer = new google.maps.FusionTablesLayer(433634);[/php]
You can expand this integration by filtering the results through the use of Fusion Tables’ sql-like query syntax. As an example, to display accidents from May 2009, change the line above to look like this:
[php]var accidents_layer = new google.maps.FusionTablesLayer(433634, {
query: ‘SELECT FullAddress FROM 433634 WHERE Year=2009 AND Month=5’
});[/php]
A quick gotcha to point out here is that Google Maps v3 only supports a SELECT operation on the location value column. So the location query above works just fine, but the COUNT query needed to get the number of accidents does not work:
[php]’SELECT COUNT() FROM 433634 WHERE Year=2009 AND Month=5′[/php]
Instead, to get the number of accidents in this case, you can use the Fusion Tables API endpoint directly:
[php]https://www.google.com/fusiontables/api/query?sql=SELECT COUNT() FROM 433634 WHERE Year=2009 AND Month=5[/php]
You can see the actual response from the count query here. Because The Bay Citizen is built on the Django framework, we can leverage the Python libraries Google provides for query generation and API calls. Also, since the location query is so similar to the count query, I consolidated the filter logic so it happens on the server side using a jQuery AJAX call. As a result, when users apply a filter, they see an updated map and results bar all thanks to the following few JavaScript lines:
[php]$(‘#filter-form’).ajaxForm({
success: function(responseText, statusText) {
var data = $.parseJSON(responseText);
accidents_layer.setMap(null);
accidents_layer = new google.maps.FusionTablesLayer(433634, {
query: data.map_query});
accidents_layer.setMap(map);
$(‘#filter-results’).html(data.results);
}
});[/php]
I was really happy with this approach. The performance hit is negligible, the code is much cleaner, and the filter logic is rewritten in the programming language I currently know best (Python).
I hope this post gives you a taste of what it’s like to work with Google Maps and Fusion Tables. Also, please note that our data is public and can be referenced at Table #433634. This means you’re free to use the same data we do to develop and design your own map interface. When we update the data, your project will be updated as well.
From our end, we don’t have to worry about our servers being overloaded with data API and map generation calls that come from your project. So by all means, hack away, improve the design, and create a better version. All we ask is that if you do come up with something cool, please link back to us, let us know, and then maybe we can even work together.